> ## Documentation Index
> Fetch the complete documentation index at: https://docs.wendung.app/llms.txt
> Use this file to discover all available pages before exploring further.
# Dashboards
> Compose funnel charts, metrics, and lists into custom views, and share them with a public link.
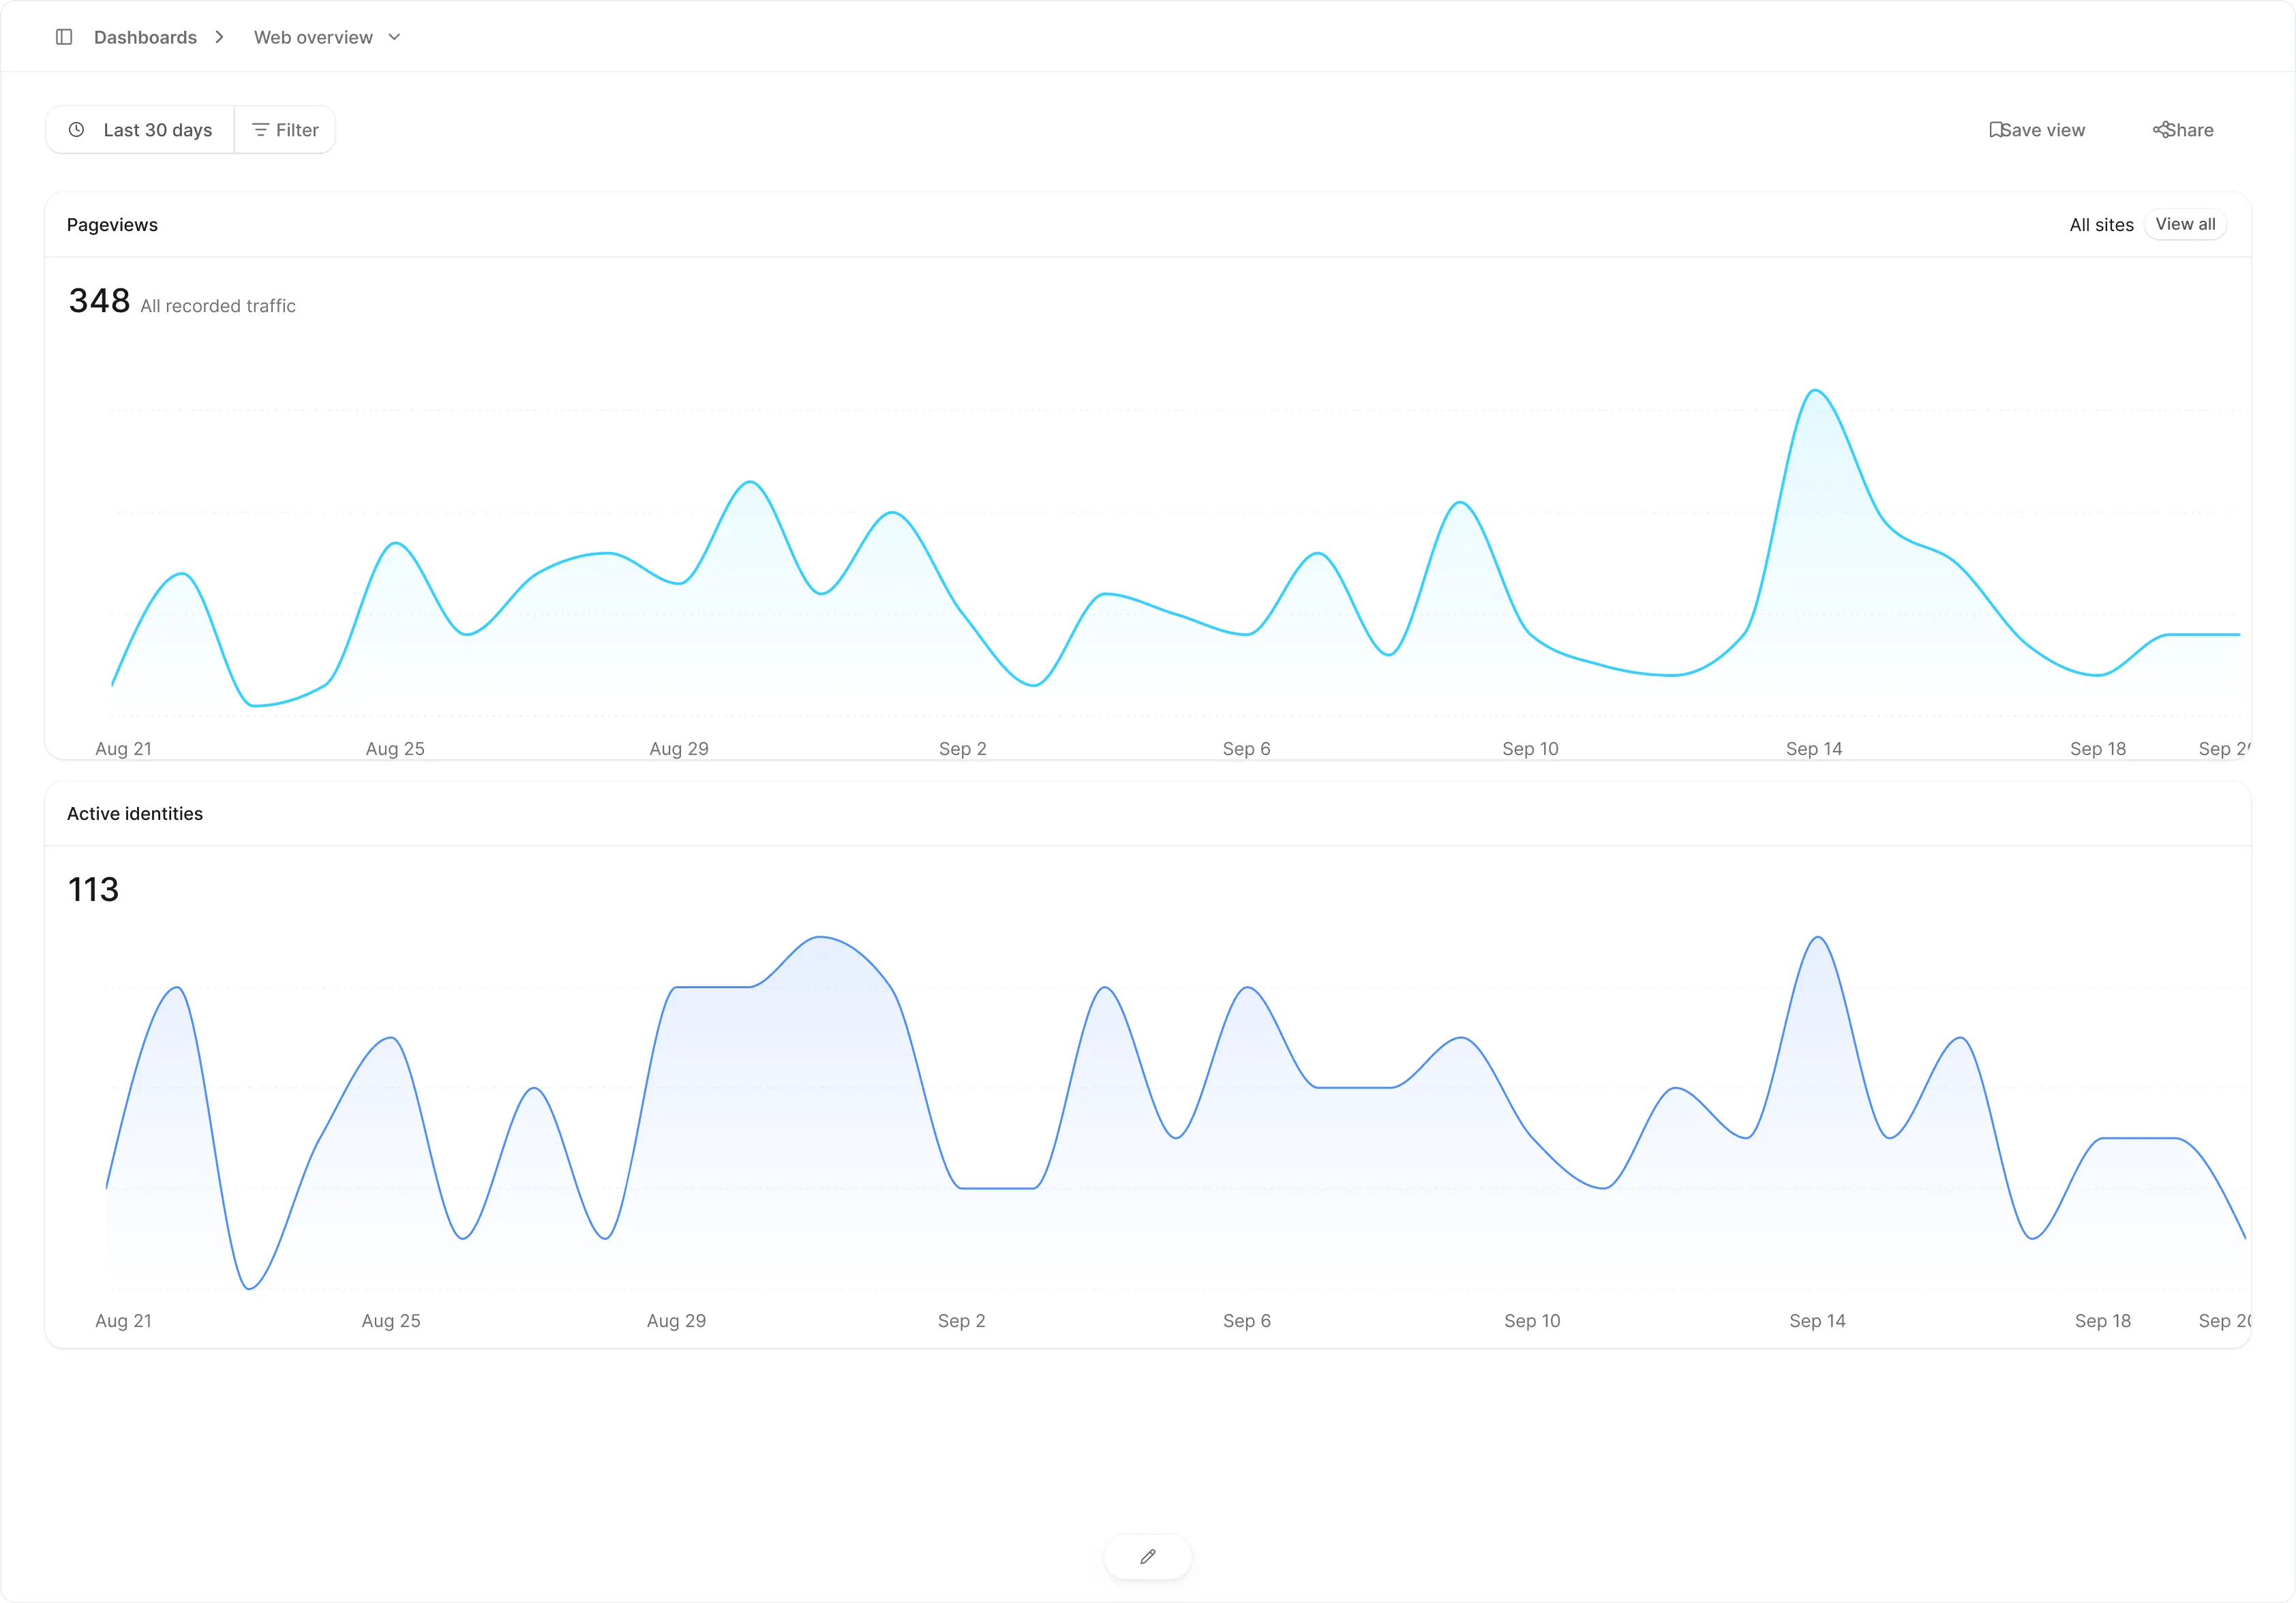
Dashboards let you compose the pieces you care about into a single view: funnel charts, metric trends, breakdowns, and lists. Build one per team, per launch, or per question you keep asking.
 ## Creating a dashboard
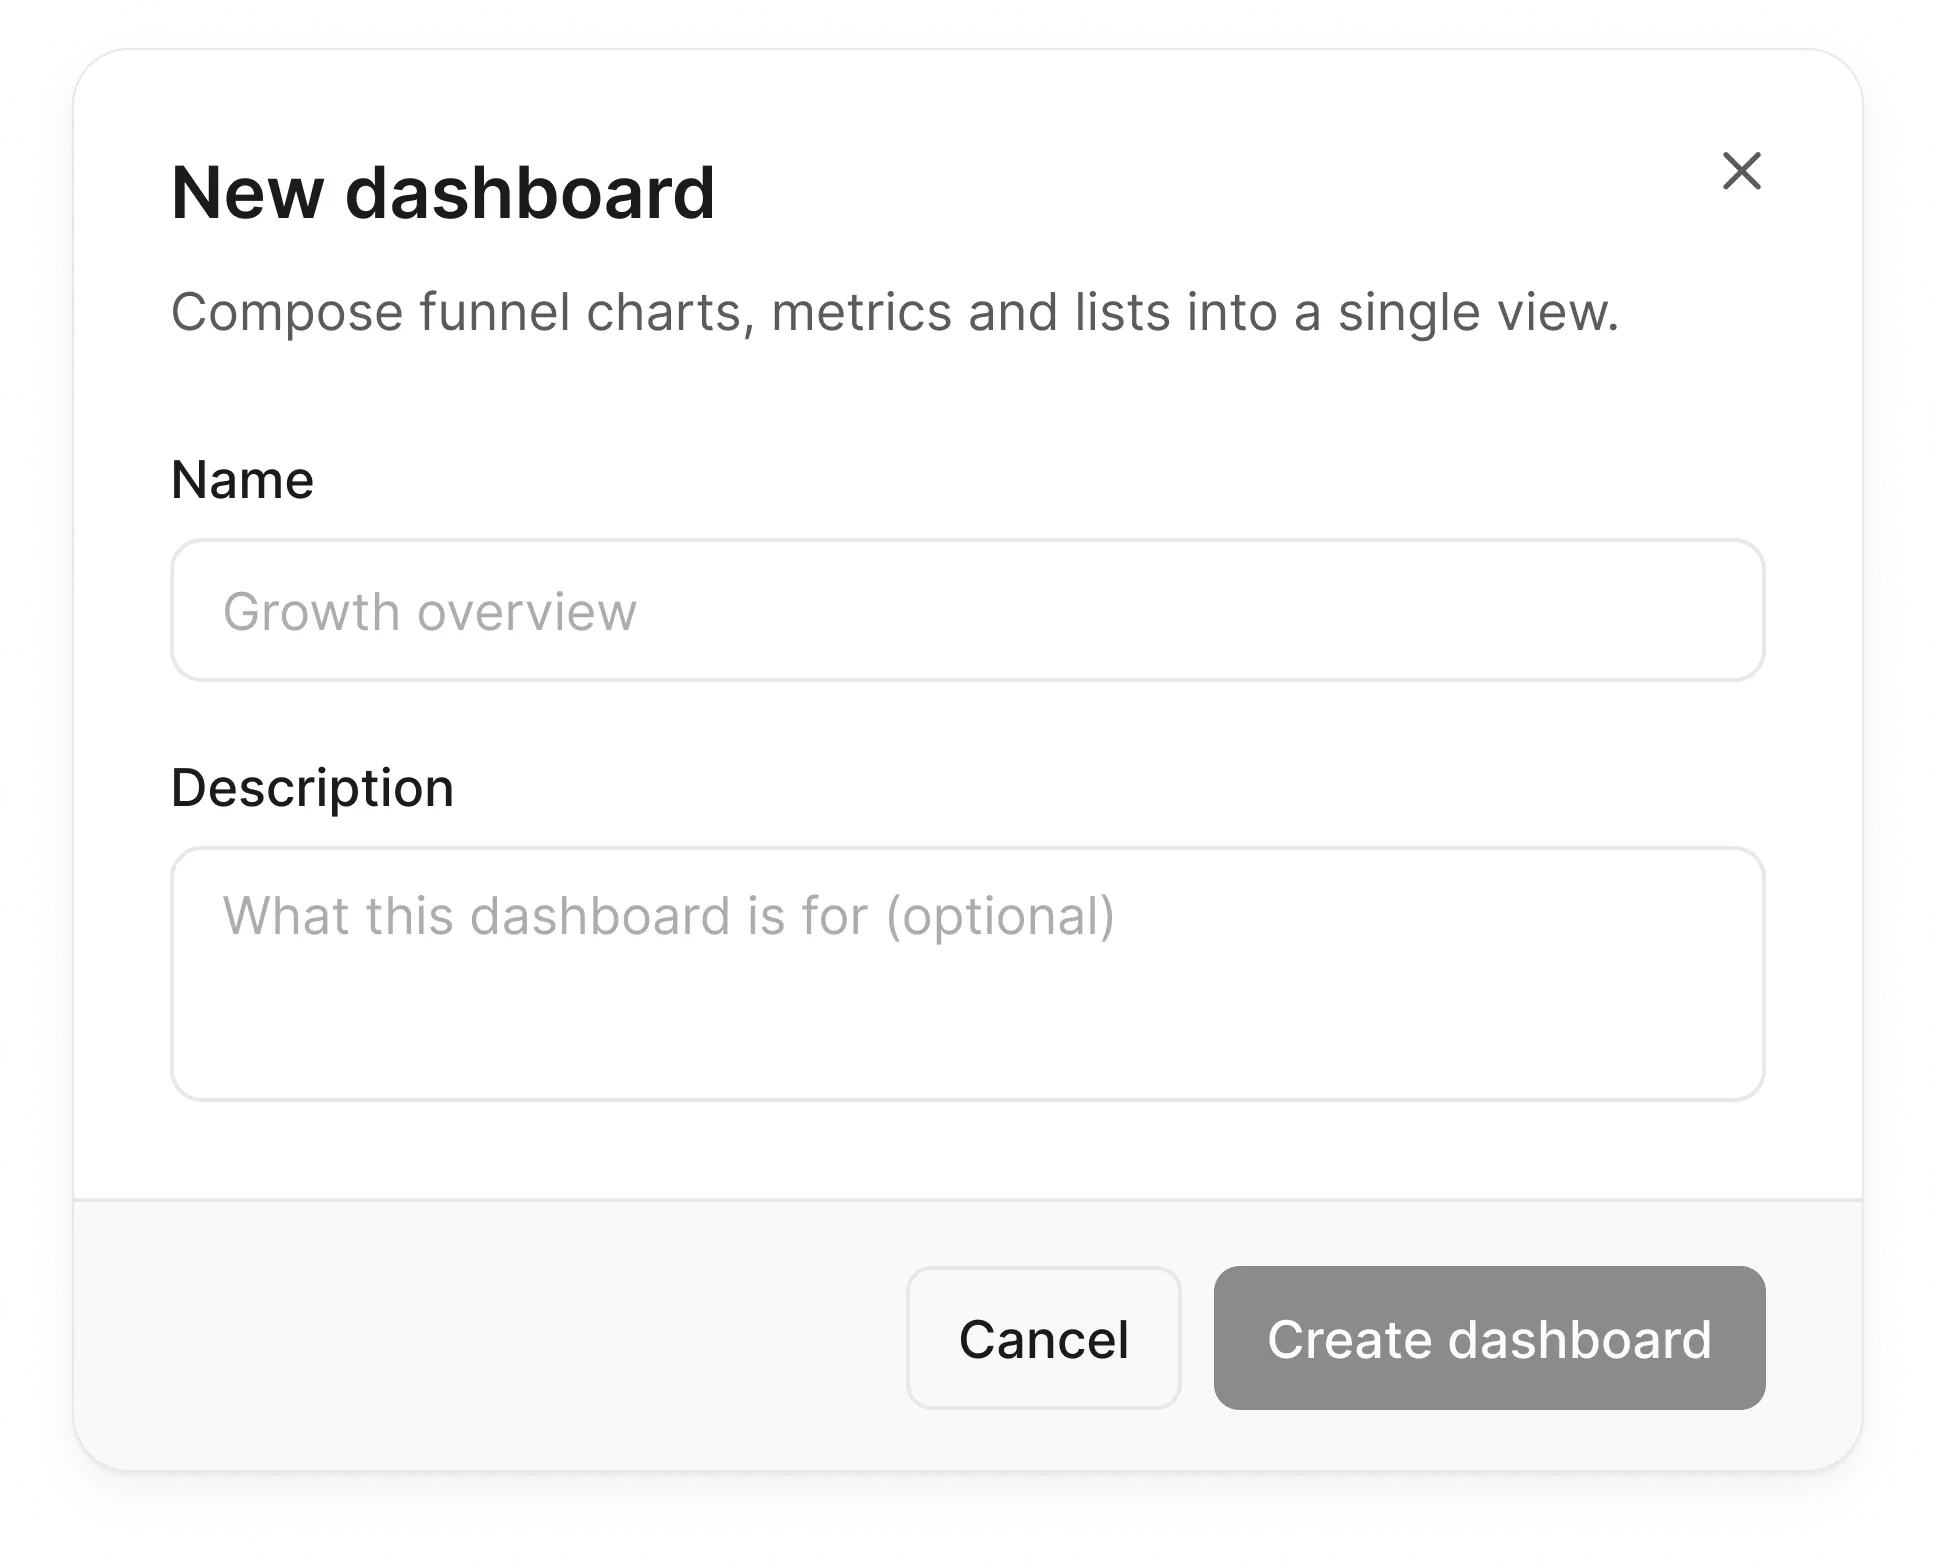
Go to **Dashboards** in the sidebar and click **New dashboard**. Give it a name and an optional description, then click **Create dashboard**.
## Creating a dashboard
Go to **Dashboards** in the sidebar and click **New dashboard**. Give it a name and an optional description, then click **Create dashboard**.
 The dashboards list shows every dashboard with its block count and when it was last updated. The row menu lets you **Rename**, **Share**, or **Delete** a dashboard.
Creating and editing dashboards requires the owner or admin role. Members can
view dashboards and use saved views, but not change the layout.
## Blocks
A dashboard is a grid of blocks. Each block is one visualization, configured independently, and a dashboard can hold up to 24 of them.
| Block | What it shows |
| - | - |
| **Funnel flow** | Conversion and drop-off across every funnel step. |
| **Conversion trend** | One funnel step's conversion rate over time. |
| **Step drop-off** | Drop-offs and conversion time between steps. |
| **Time to convert** | How long conversion takes between two funnel steps. |
| **Metric trend** | One project metric over time. |
| **Metric** | A metric value and its change from the prior period. |
| **Segment breakdown** | Identities by country, OS, or another dimension. |
| **Top funnels** | Which funnels have the largest drop-off this period. |
| **Recent identities** | The people and visitors seen most recently. |
| **Recent events** | The latest events and their delivery status. |
| **Web summary** | Visitors, pageviews, bounce rate, and other site metrics for one site or all sites. |
| **Web trend** | One site metric over time, from visitors to session duration. |
| **Web breakdown** | Top pages, sources, countries, or devices for a site. |
## Editing the layout
Click the pencil button at the bottom of the dashboard to enter edit mode. The dock expands to **Add block**, **Page width**, **Cancel**, and **Save**.
The dashboards list shows every dashboard with its block count and when it was last updated. The row menu lets you **Rename**, **Share**, or **Delete** a dashboard.
Creating and editing dashboards requires the owner or admin role. Members can
view dashboards and use saved views, but not change the layout.
## Blocks
A dashboard is a grid of blocks. Each block is one visualization, configured independently, and a dashboard can hold up to 24 of them.
| Block | What it shows |
| - | - |
| **Funnel flow** | Conversion and drop-off across every funnel step. |
| **Conversion trend** | One funnel step's conversion rate over time. |
| **Step drop-off** | Drop-offs and conversion time between steps. |
| **Time to convert** | How long conversion takes between two funnel steps. |
| **Metric trend** | One project metric over time. |
| **Metric** | A metric value and its change from the prior period. |
| **Segment breakdown** | Identities by country, OS, or another dimension. |
| **Top funnels** | Which funnels have the largest drop-off this period. |
| **Recent identities** | The people and visitors seen most recently. |
| **Recent events** | The latest events and their delivery status. |
| **Web summary** | Visitors, pageviews, bounce rate, and other site metrics for one site or all sites. |
| **Web trend** | One site metric over time, from visitors to session duration. |
| **Web breakdown** | Top pages, sources, countries, or devices for a site. |
## Editing the layout
Click the pencil button at the bottom of the dashboard to enter edit mode. The dock expands to **Add block**, **Page width**, **Cancel**, and **Save**.
 ### Adding a block
Click **Add block** and pick a block type. Funnel blocks are only available once your project has at least one funnel.
### Adding a block
Click **Add block** and pick a block type. Funnel blocks are only available once your project has at least one funnel.
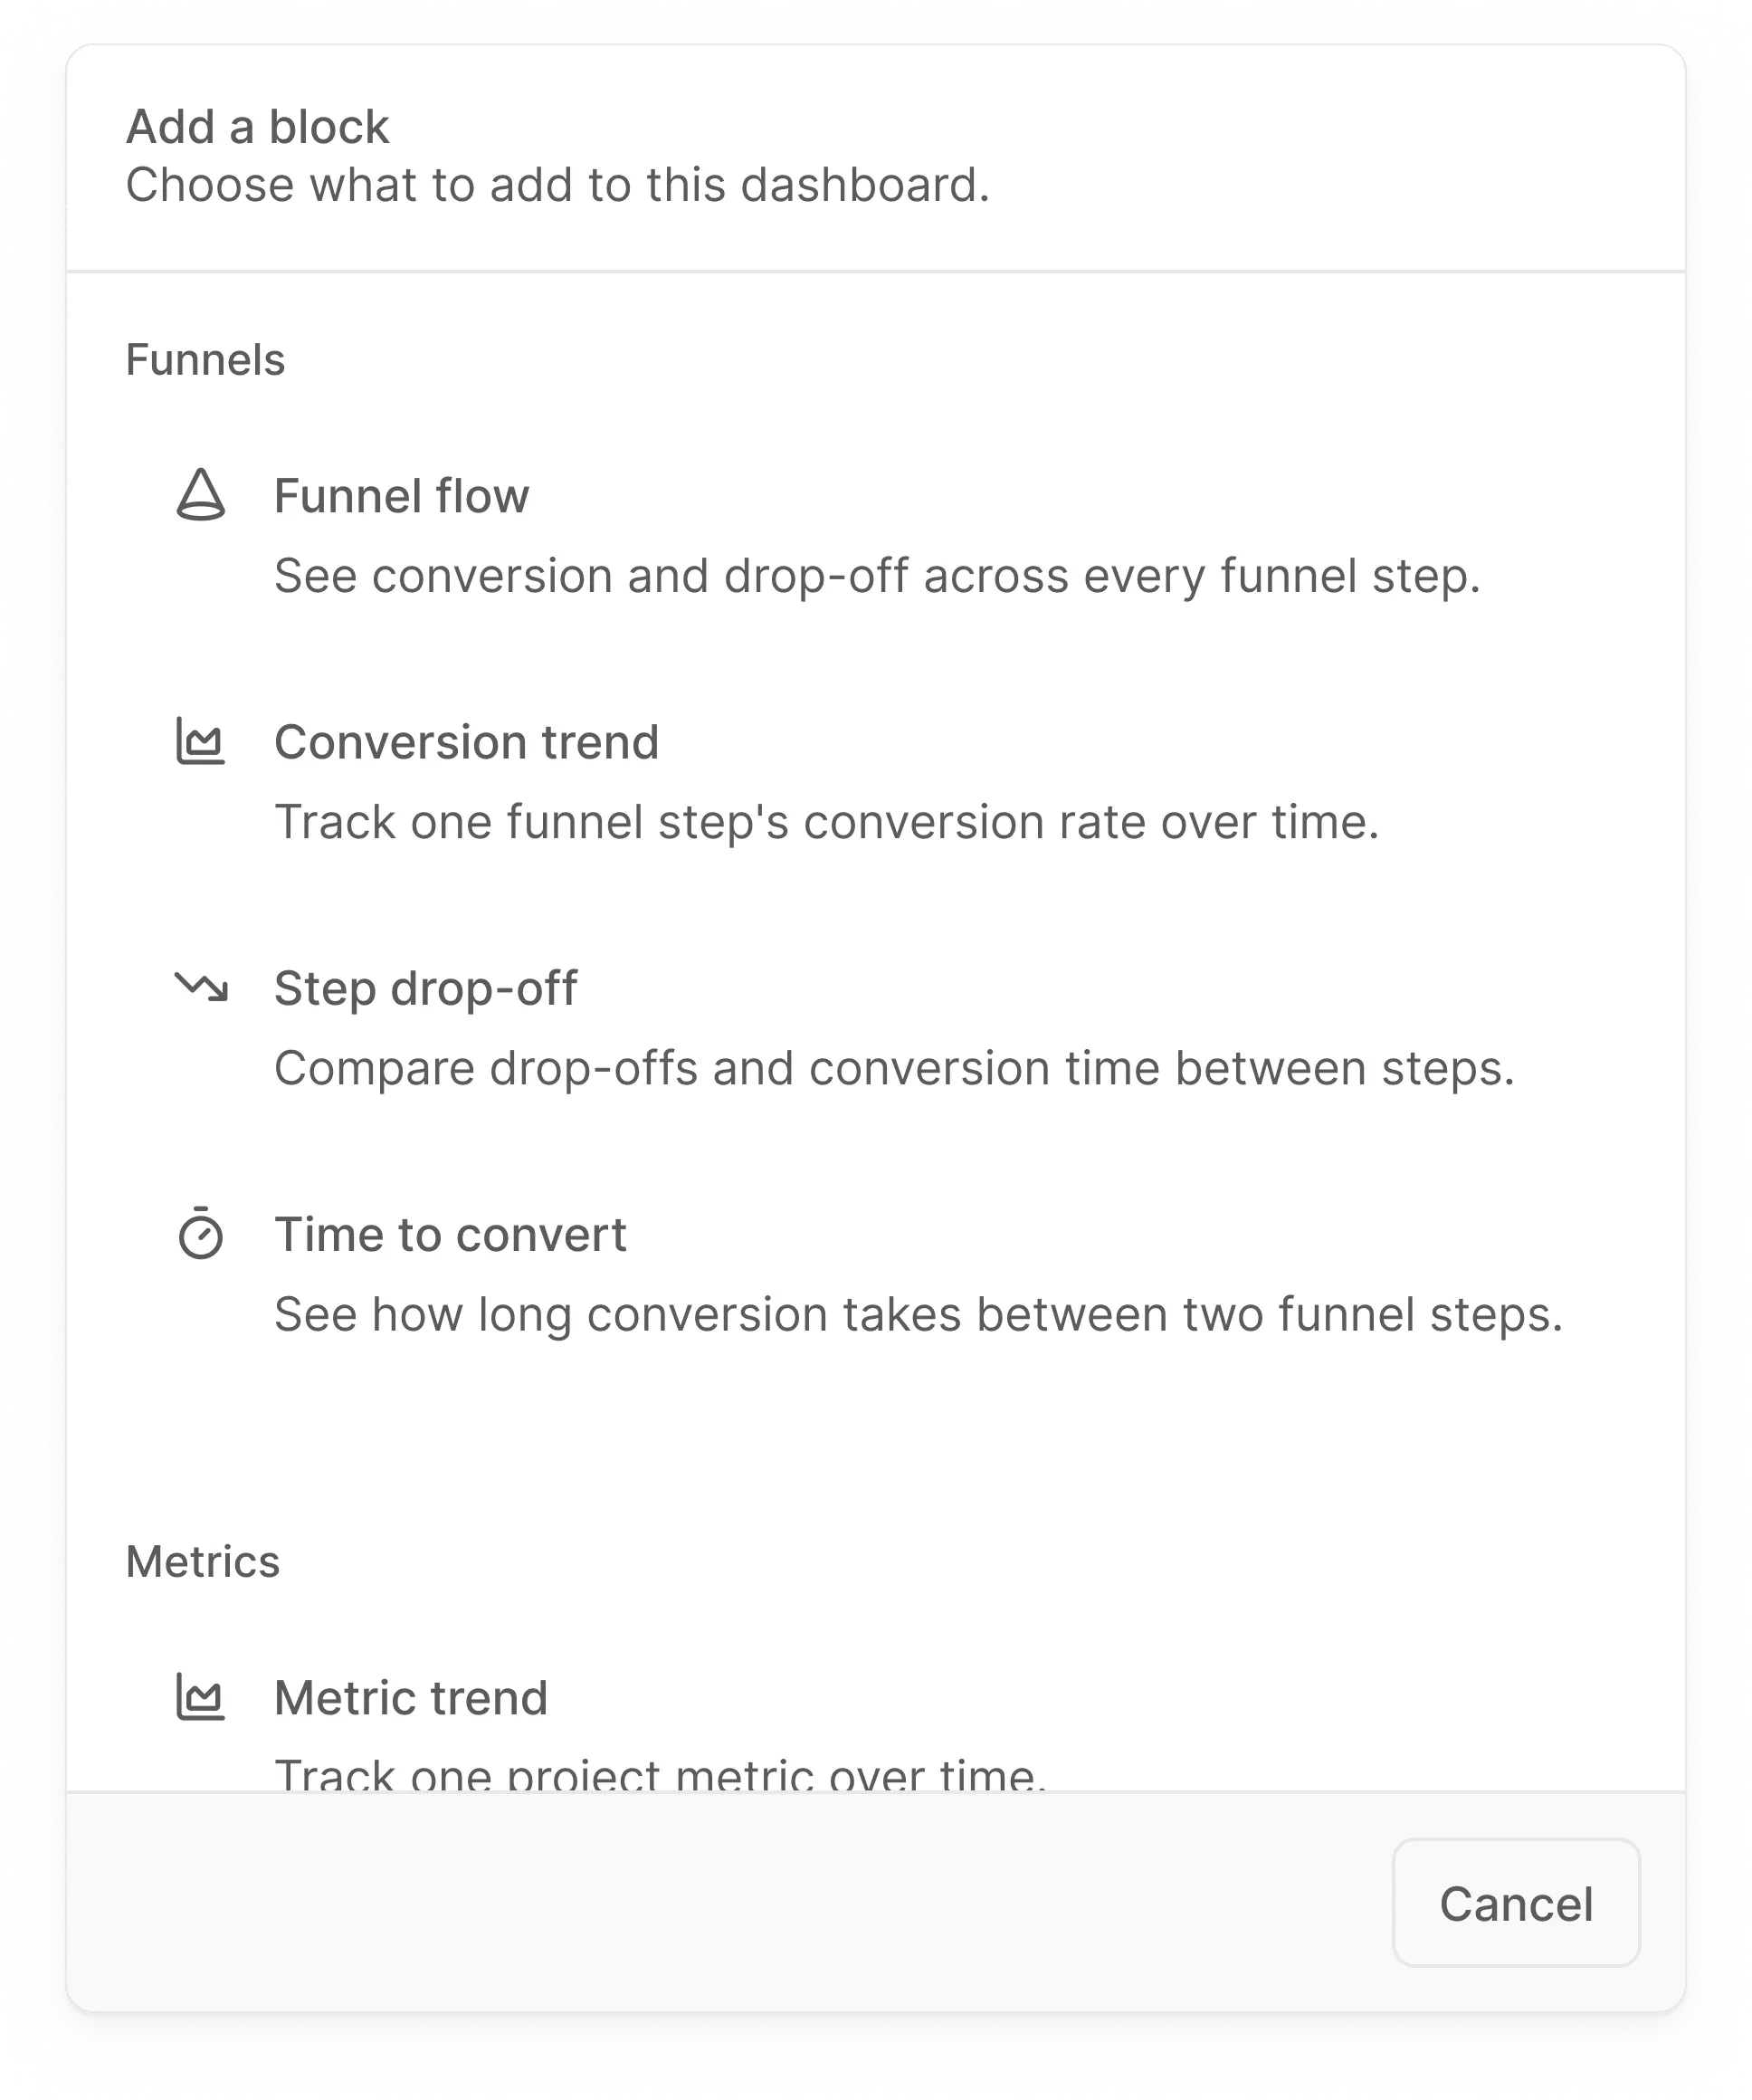 * Funnel blocks ask for the **funnel**, and depending on the type a **step**, a **from step** and **to step**, or a **metric**.
* Metric blocks ask for the **metric**: active identities, total events, events per identity (avg or median), or single-event rate.
* Segment breakdown blocks ask for the **dimension**.
* Web blocks ask for the **site** (one hostname or all sites), plus a **metric** for the trend block or a **dimension** for the breakdown block. They need a plan with a pageview allowance.
* Every block has a **Period** setting. **Dashboard period** follows the date range picker at the top of the dashboard. Alternatively, pin the block to a fixed range like **Last 90 days**. Blocks with a fixed period show a clock badge in their header.
### Arranging blocks
While in edit mode:
* **Move** blocks by dragging the grip handle in their header.
* **Resize** blocks by dragging their edges. Each block type has a sensible minimum size.
* **Configure** or **Remove** an existing block from the menu in its header.
* **Page width** switches between **Contained**, which keeps the dashboard centered at a readable width, and **Full width**.
Click **Save** to persist the layout, or **Cancel** to discard your changes.
## Filters, date range, and saved views
Dashboards have the same filter bar and date range picker as the rest of the app, applied to every block that follows the dashboard period. Filters cover **Plan**, **Source**, **Country**, **Device type**, **Browser**, **OS**, plus custom user traits and event properties.
Like funnels, dashboards support up to 15 [saved views](/help/funnel-details#saved-views) via the bookmark icon. Dashboard views are shared: they are visible to everyone in the workspace, and the default view applies for everyone who opens the dashboard.
## Sharing a dashboard
Click the share icon at the top right to publish a read-only version of the dashboard that anyone with the link can view.
* Funnel blocks ask for the **funnel**, and depending on the type a **step**, a **from step** and **to step**, or a **metric**.
* Metric blocks ask for the **metric**: active identities, total events, events per identity (avg or median), or single-event rate.
* Segment breakdown blocks ask for the **dimension**.
* Web blocks ask for the **site** (one hostname or all sites), plus a **metric** for the trend block or a **dimension** for the breakdown block. They need a plan with a pageview allowance.
* Every block has a **Period** setting. **Dashboard period** follows the date range picker at the top of the dashboard. Alternatively, pin the block to a fixed range like **Last 90 days**. Blocks with a fixed period show a clock badge in their header.
### Arranging blocks
While in edit mode:
* **Move** blocks by dragging the grip handle in their header.
* **Resize** blocks by dragging their edges. Each block type has a sensible minimum size.
* **Configure** or **Remove** an existing block from the menu in its header.
* **Page width** switches between **Contained**, which keeps the dashboard centered at a readable width, and **Full width**.
Click **Save** to persist the layout, or **Cancel** to discard your changes.
## Filters, date range, and saved views
Dashboards have the same filter bar and date range picker as the rest of the app, applied to every block that follows the dashboard period. Filters cover **Plan**, **Source**, **Country**, **Device type**, **Browser**, **OS**, plus custom user traits and event properties.
Like funnels, dashboards support up to 15 [saved views](/help/funnel-details#saved-views) via the bookmark icon. Dashboard views are shared: they are visible to everyone in the workspace, and the default view applies for everyone who opens the dashboard.
## Sharing a dashboard
Click the share icon at the top right to publish a read-only version of the dashboard that anyone with the link can view.
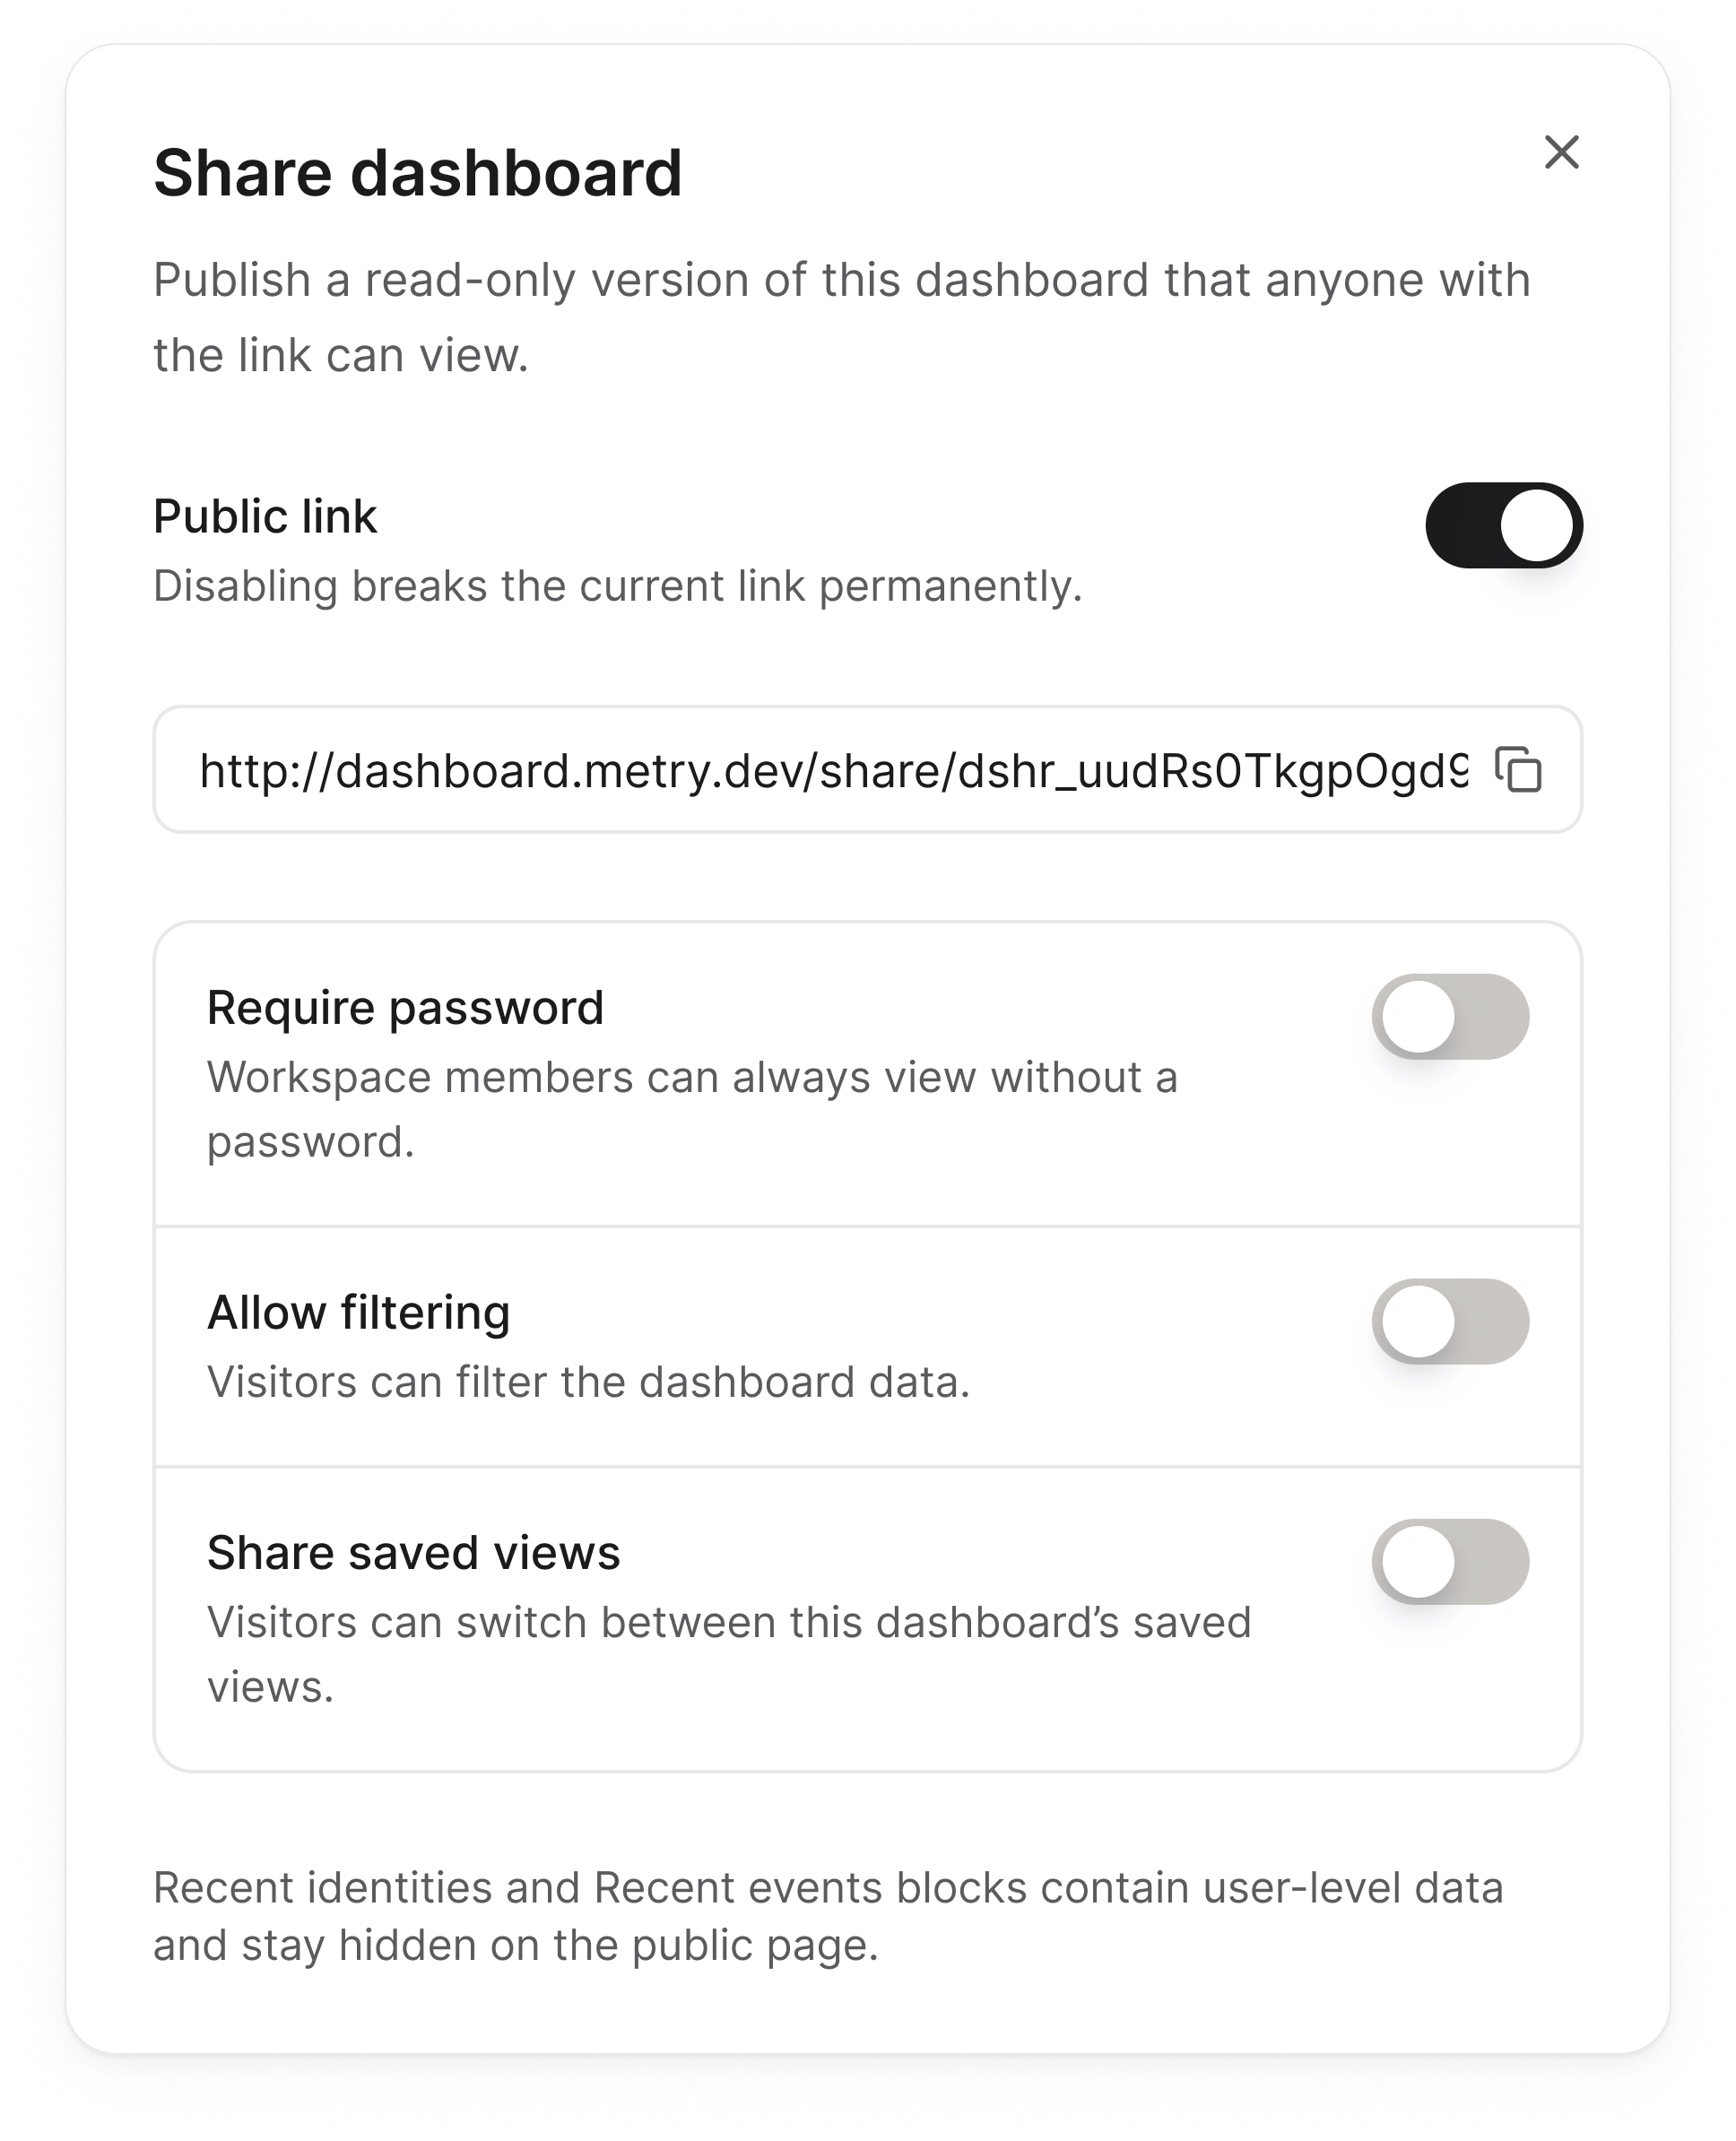 Once the **Public link** toggle is on, you can:
* **Require a password**. Workspace members can always view without one.
* **Allow filtering**, so visitors can filter the dashboard data.
* **Share saved views**, so visitors can switch between the dashboard's saved views.
Recent identities and Recent events blocks contain user-level data and stay
hidden on the public page. Disabling the public link breaks the current URL
permanently.
This documentation is built and hosted on [Mintlify](https://mintlify.com), a developer documentation platform.
Once the **Public link** toggle is on, you can:
* **Require a password**. Workspace members can always view without one.
* **Allow filtering**, so visitors can filter the dashboard data.
* **Share saved views**, so visitors can switch between the dashboard's saved views.
Recent identities and Recent events blocks contain user-level data and stay
hidden on the public page. Disabling the public link breaks the current URL
permanently.
This documentation is built and hosted on [Mintlify](https://mintlify.com), a developer documentation platform.