> ## Documentation Index
> Fetch the complete documentation index at: https://docs.wendung.app/llms.txt
> Use this file to discover all available pages before exploring further.
# Events
> Inspect every request your SDK sends and debug why events were delivered, rejected, or quarantined.
The Events page is the delivery log for your project. Every request your SDK sends shows up here with its status, so when a number looks wrong somewhere else in the app, this is where you find out whether the data ever arrived.
 ## The request log
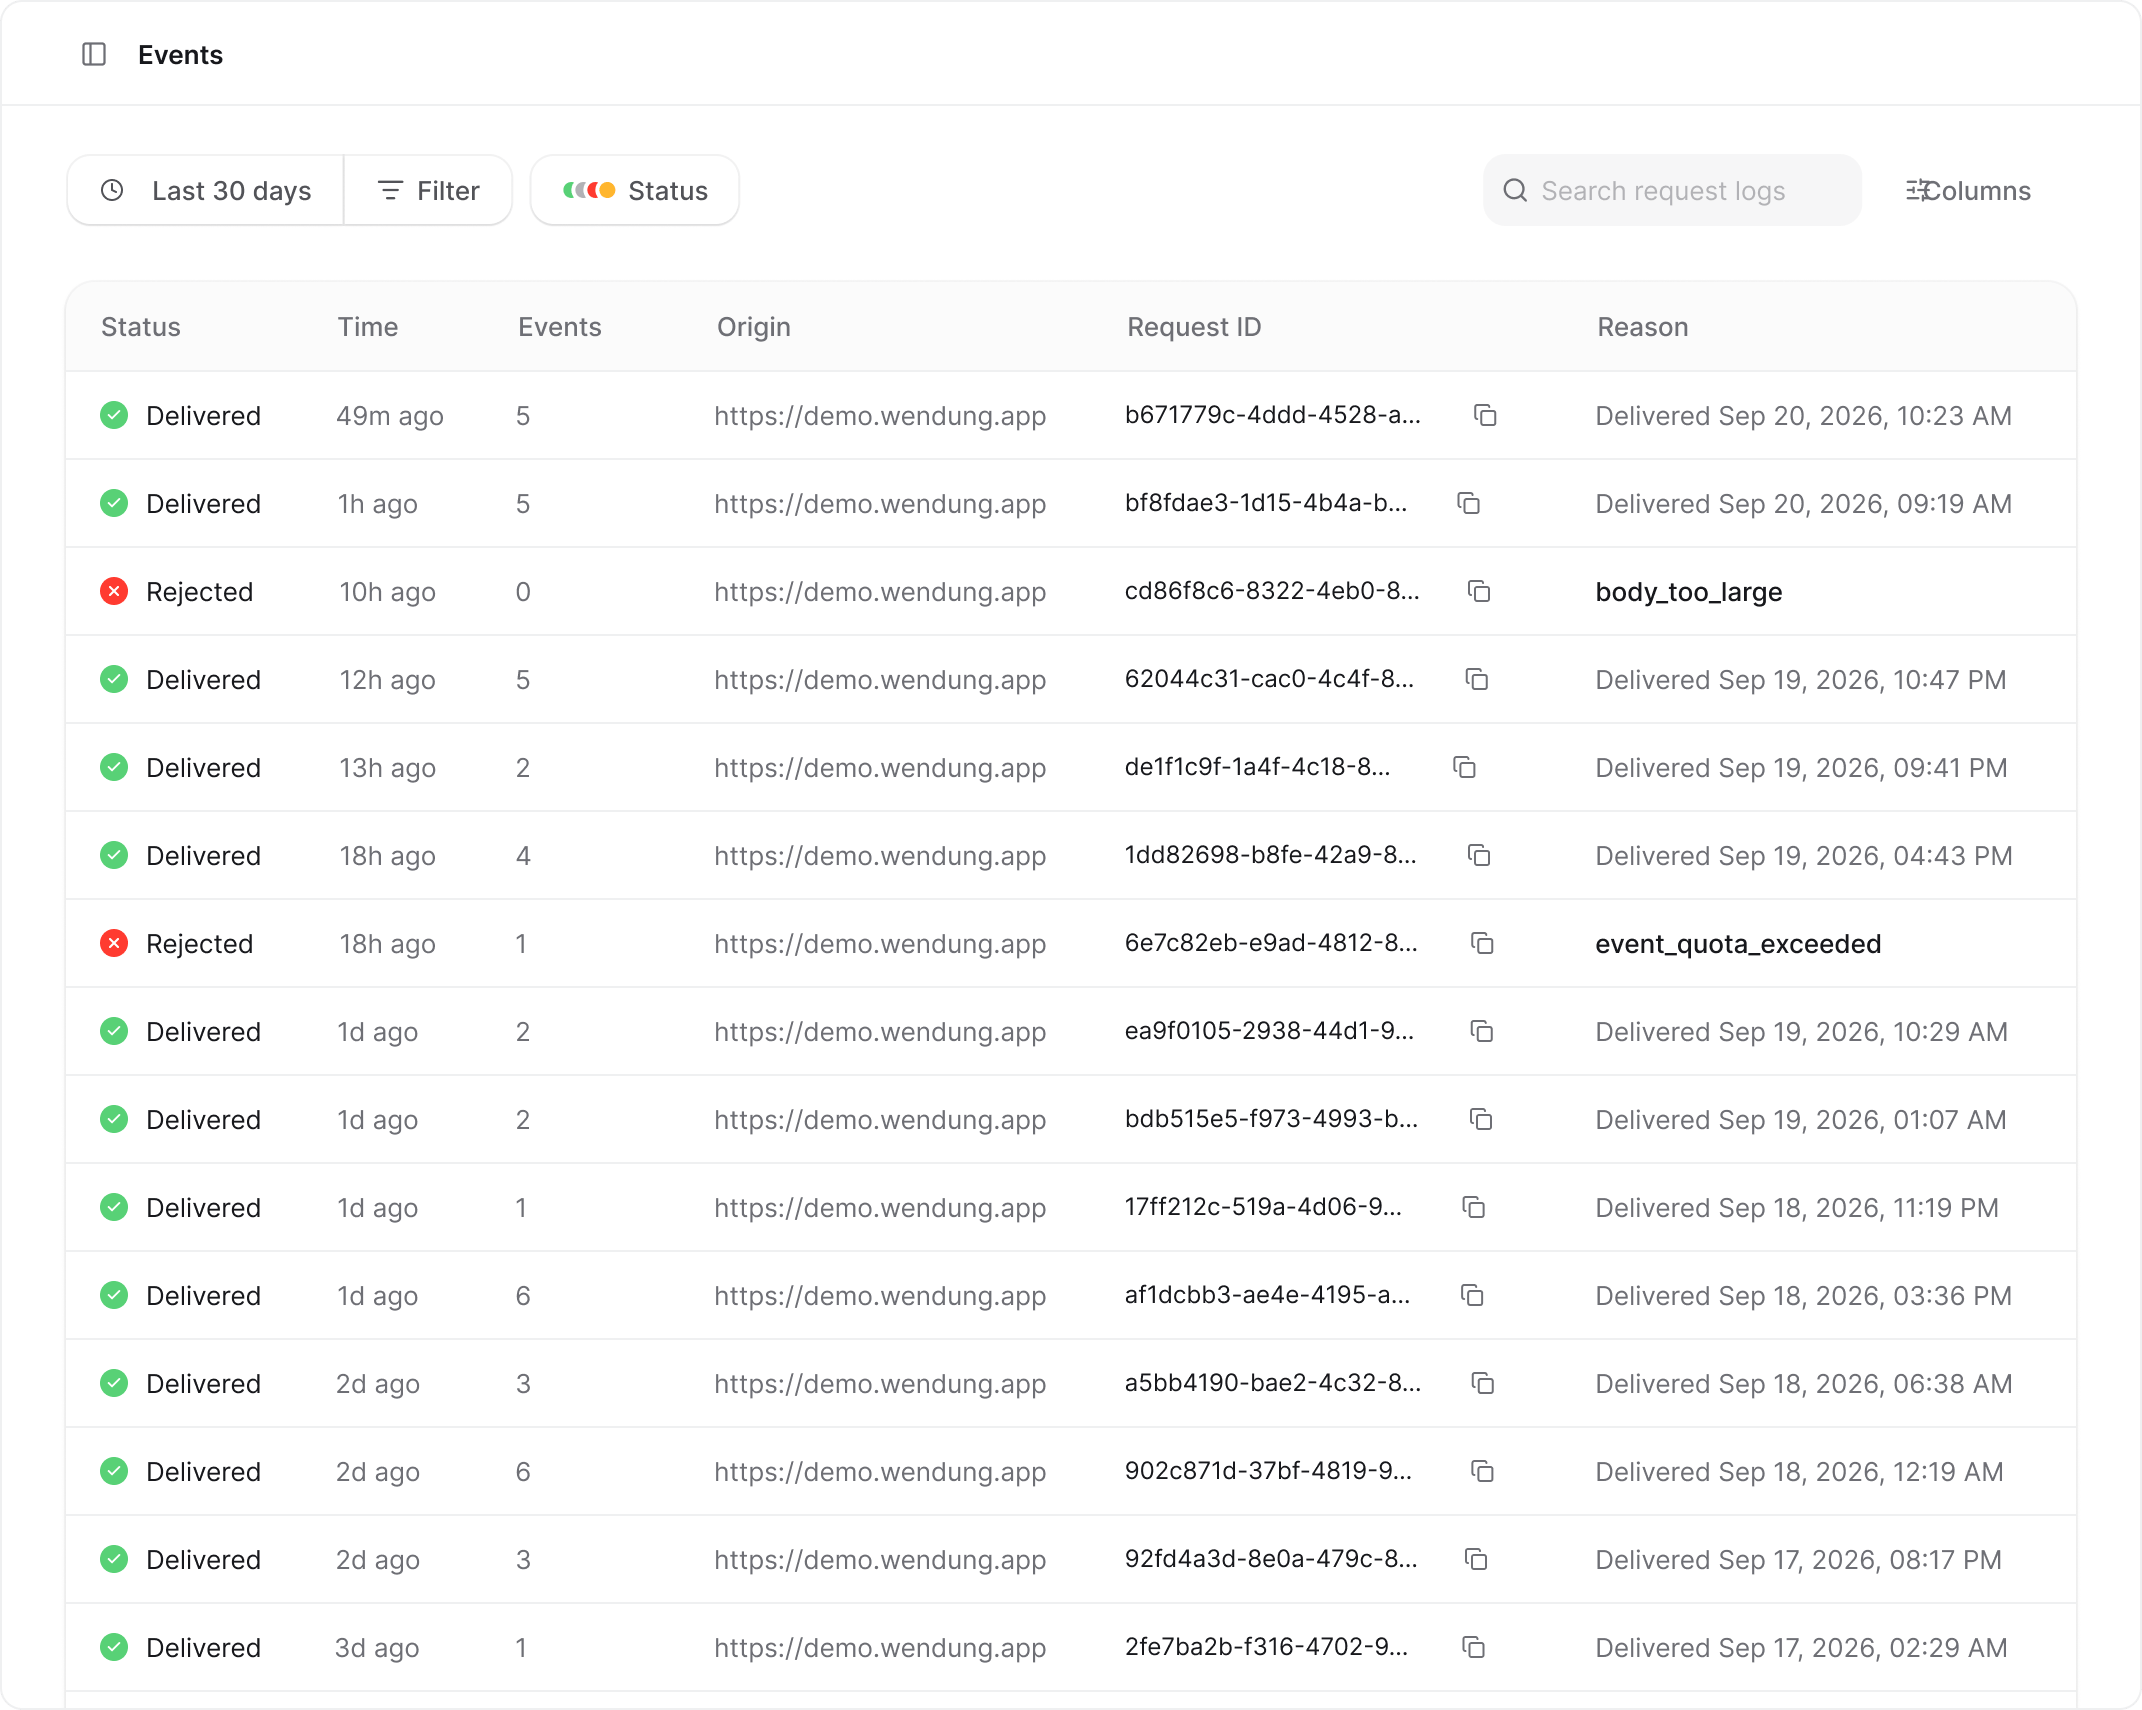
Each row is one request from the SDK, which can contain several events in a batch. The columns show the status, when the request arrived, how many events it carried, the origin it was sent from, a human-readable reason, and the request ID with a copy button.
A request can have one of these statuses:
| Status | Meaning |
| - | - |
| **Delivered** | Everything in the request was accepted and stored. |
| **Queued** | The request was received and is waiting to be processed. |
| **Retrying** | Processing failed and Wendung is retrying automatically. |
| **Partial failure** | Some events were stored, others were quarantined. The reason column tells you why, for example "Some rows were quarantined". |
| **Rejected** | The whole request was turned away, for example from an origin that isn't allowed. |
| **Failed final** | Processing failed and no more retries will happen. |
## Finding the right request
The toolbar gives you a few ways to narrow the log down:
* **Search** across request logs
* The **status select** limits the list to one status, which makes "show me everything that failed" a one-click question
* **Filters** opens advanced filters for exact lookups: **Request ID**, **Batch ID**, **Session ID**, **User ID hash**, **Origin**, and **SDK version**
* The **date range picker** works like everywhere else in the app
* **Columns** lets you hide columns you don't need
Debugging a specific user's session? Grab the session ID from their profile
on the Users page and paste it into the Session ID filter to see exactly
which of their requests arrived.
## Request details
Click a row to open the full request log. This is the fastest way to answer "why didn't this event show up".
## The request log
Each row is one request from the SDK, which can contain several events in a batch. The columns show the status, when the request arrived, how many events it carried, the origin it was sent from, a human-readable reason, and the request ID with a copy button.
A request can have one of these statuses:
| Status | Meaning |
| - | - |
| **Delivered** | Everything in the request was accepted and stored. |
| **Queued** | The request was received and is waiting to be processed. |
| **Retrying** | Processing failed and Wendung is retrying automatically. |
| **Partial failure** | Some events were stored, others were quarantined. The reason column tells you why, for example "Some rows were quarantined". |
| **Rejected** | The whole request was turned away, for example from an origin that isn't allowed. |
| **Failed final** | Processing failed and no more retries will happen. |
## Finding the right request
The toolbar gives you a few ways to narrow the log down:
* **Search** across request logs
* The **status select** limits the list to one status, which makes "show me everything that failed" a one-click question
* **Filters** opens advanced filters for exact lookups: **Request ID**, **Batch ID**, **Session ID**, **User ID hash**, **Origin**, and **SDK version**
* The **date range picker** works like everywhere else in the app
* **Columns** lets you hide columns you don't need
Debugging a specific user's session? Grab the session ID from their profile
on the Users page and paste it into the Session ID filter to see exactly
which of their requests arrived.
## Request details
Click a row to open the full request log. This is the fastest way to answer "why didn't this event show up".
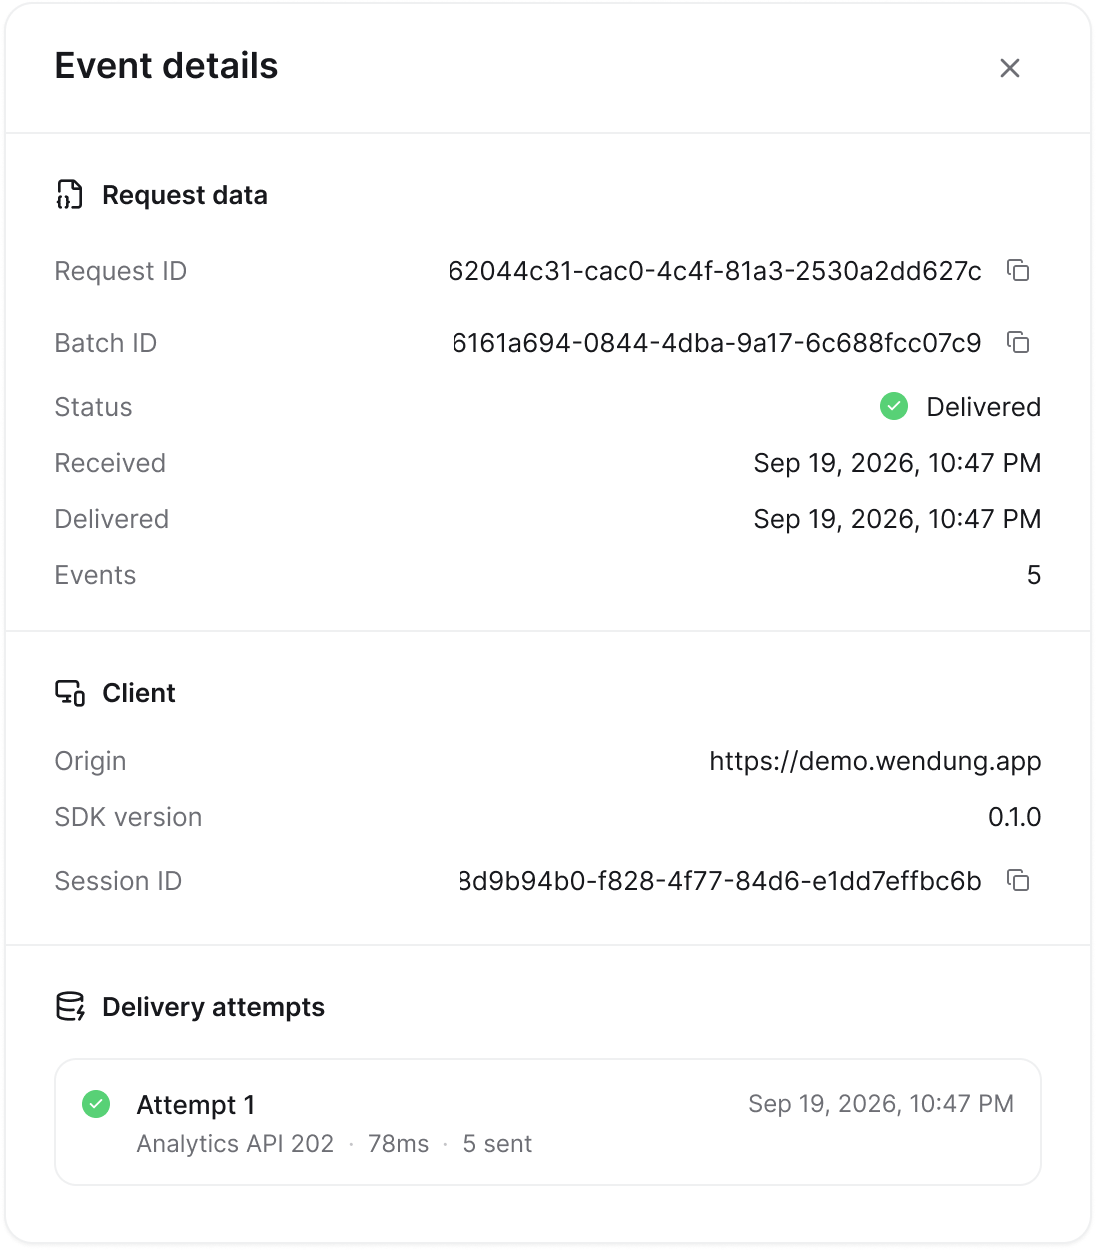 The drawer is split into three sections:
* **Request**: the request and batch IDs, status, when the request was received and delivered, and how many events it contained.
* **Client**: the origin the request came from, the SDK version, and the browser, OS, device type, and location when known.
* **Payload summary**: the session and user the events belong to, and what the batch contained.
For anything other than Delivered, the drawer also shows the reason, so you can tell the difference between a misconfigured origin, a quarantined payload, and a temporary processing issue. Rejections with the reasons `rate_limited` or `event_quota_exceeded` mean the project hit a [plan limit](/help/plans) rather than a technical problem.
Requests from an origin that isn't on your allowed origins list are rejected.
If you see rejections right after a deploy, check **Settings** and add the
new domain to allowed origins. When the rejected origin is `localhost`, turn
on [Dev mode](/help/settings#dev-mode) instead of adding it to the list.
This documentation is built and hosted on [Mintlify](https://mintlify.com), a developer documentation platform.
The drawer is split into three sections:
* **Request**: the request and batch IDs, status, when the request was received and delivered, and how many events it contained.
* **Client**: the origin the request came from, the SDK version, and the browser, OS, device type, and location when known.
* **Payload summary**: the session and user the events belong to, and what the batch contained.
For anything other than Delivered, the drawer also shows the reason, so you can tell the difference between a misconfigured origin, a quarantined payload, and a temporary processing issue. Rejections with the reasons `rate_limited` or `event_quota_exceeded` mean the project hit a [plan limit](/help/plans) rather than a technical problem.
Requests from an origin that isn't on your allowed origins list are rejected.
If you see rejections right after a deploy, check **Settings** and add the
new domain to allowed origins. When the rejected origin is `localhost`, turn
on [Dev mode](/help/settings#dev-mode) instead of adding it to the list.
This documentation is built and hosted on [Mintlify](https://mintlify.com), a developer documentation platform.