> ## Documentation Index
> Fetch the complete documentation index at: https://docs.wendung.app/llms.txt
> Use this file to discover all available pages before exploring further.
# Overview
> Understand your project at a glance. The Funnels tab covers identities, events, and engagement; the Web tab covers your sites.
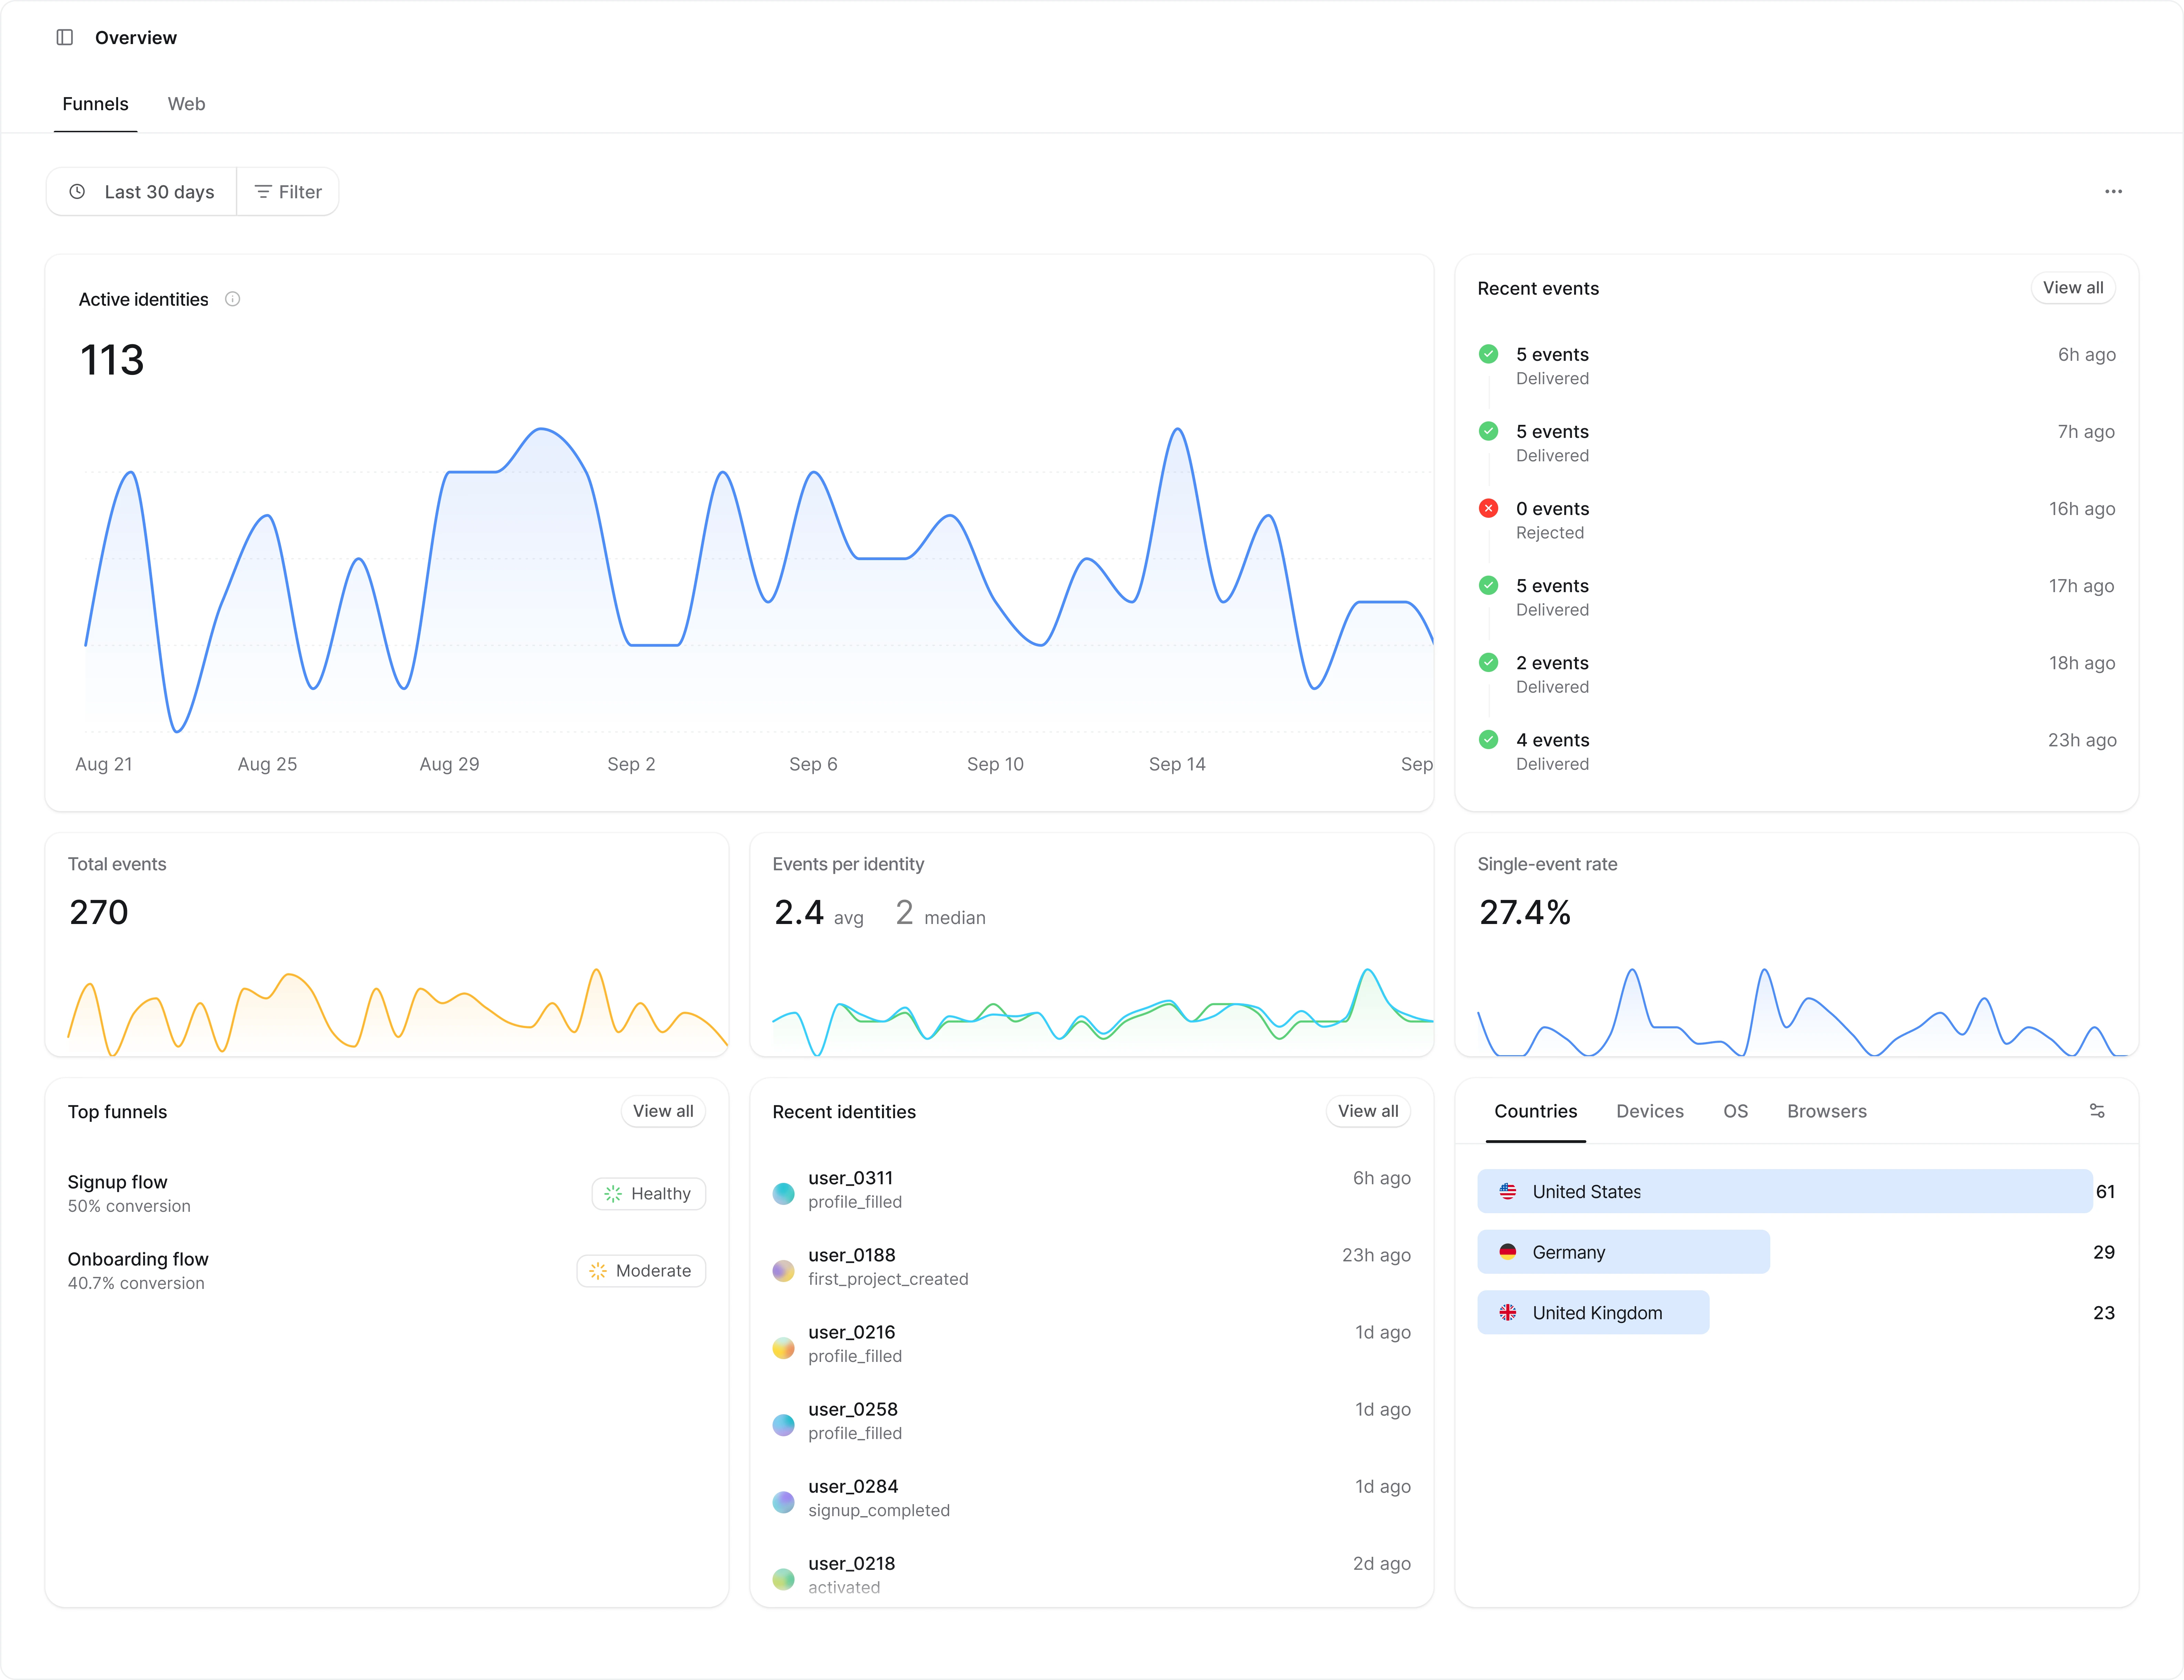
The Overview page is the first thing you see when you open a project. It has two tabs under the title. **Funnels** answers how many people used your product, how much they did, and how that breaks down by country, device, and more. **Web** shows traffic for your registered sites. The page reopens on the tab you looked at last.
 ## Web tab
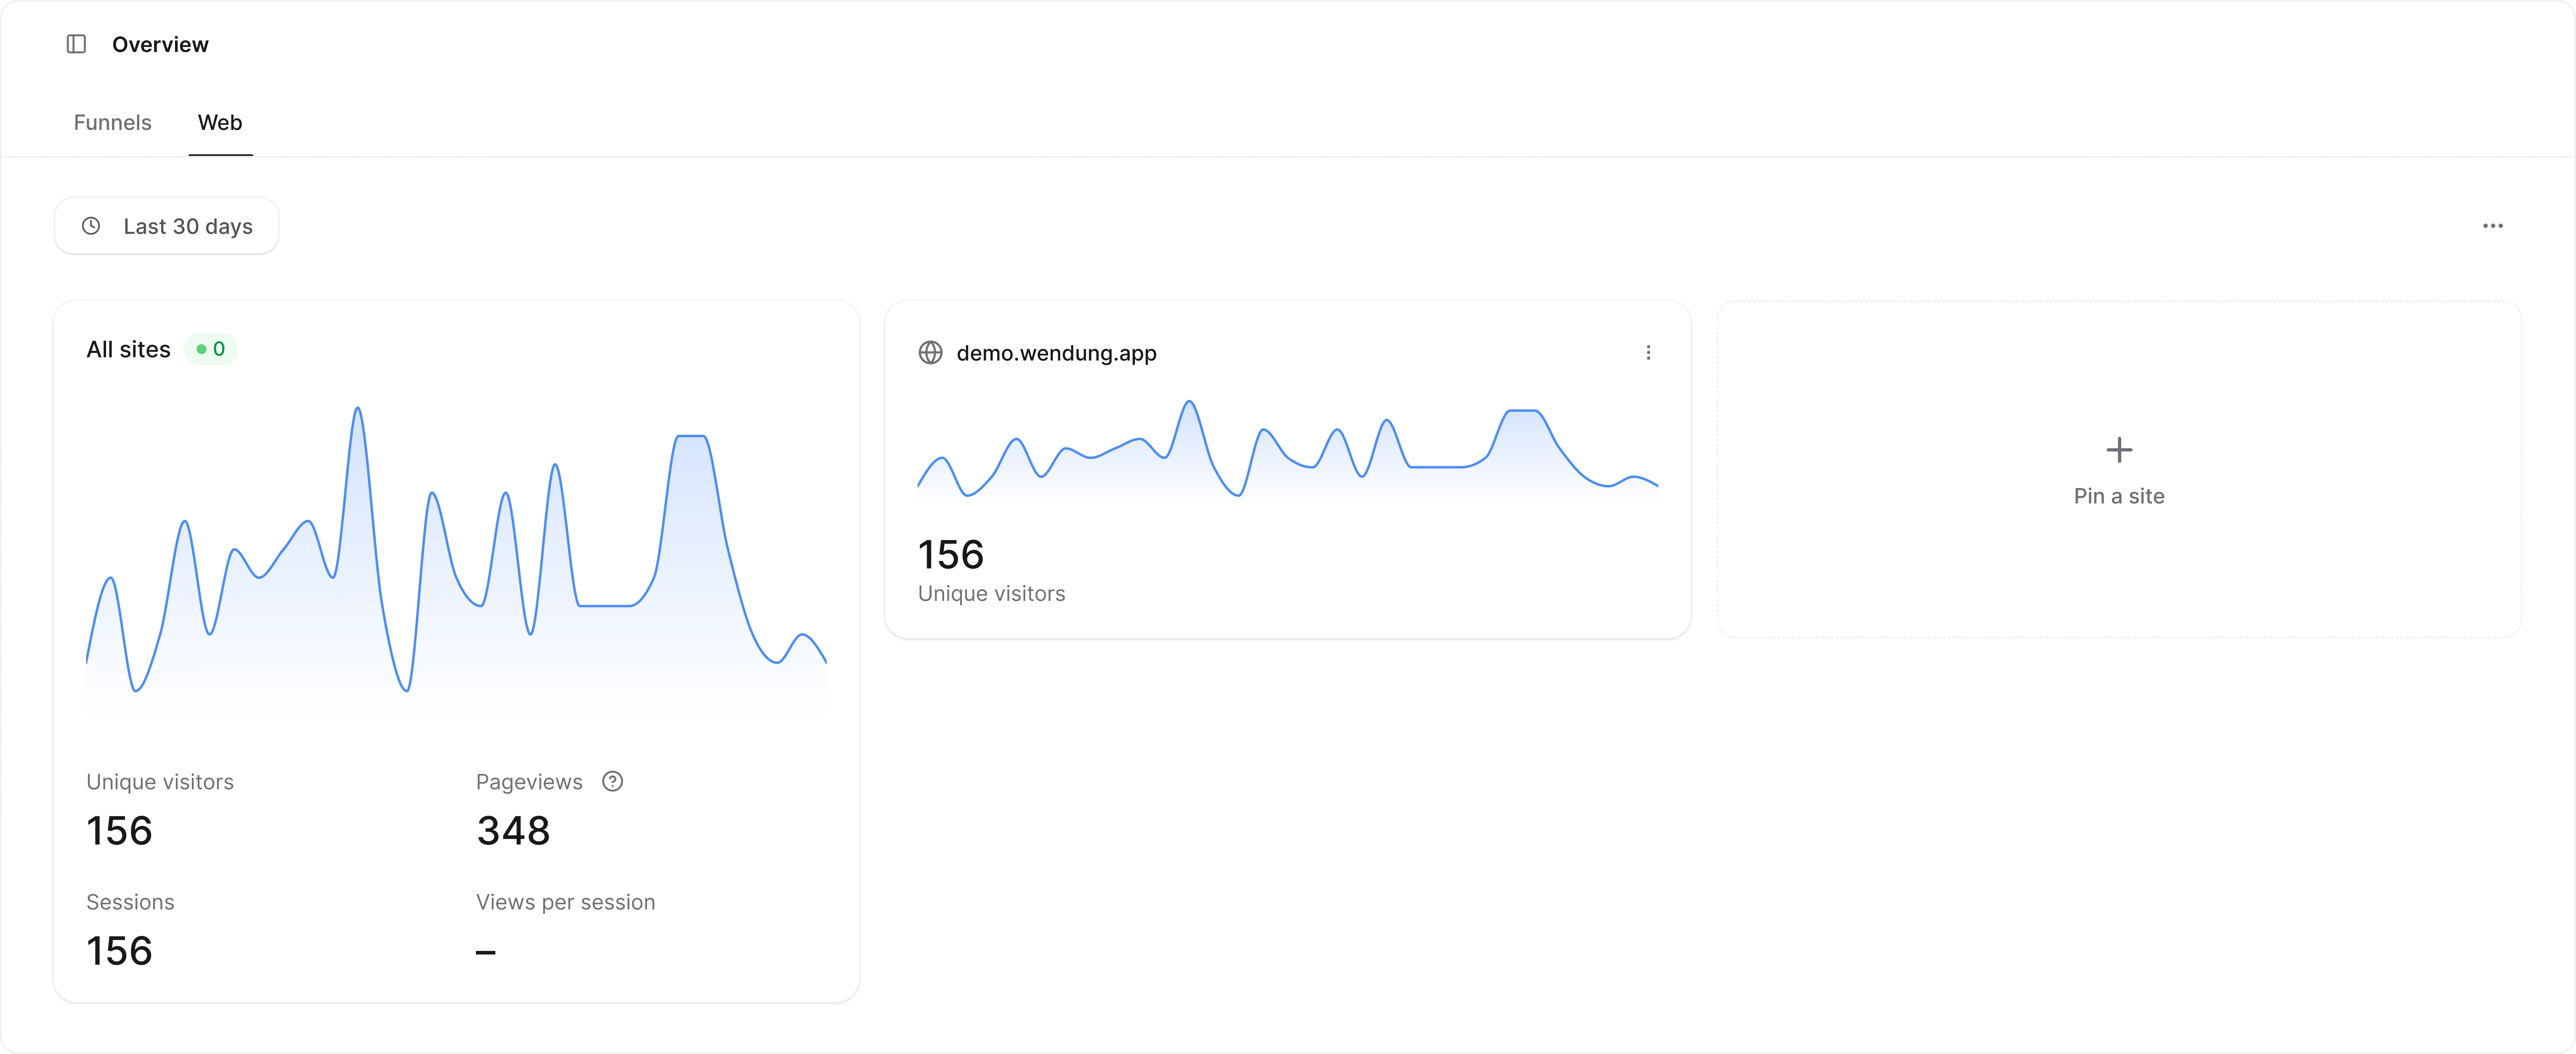 The **All sites** card combines every hostname the project receives pageviews from: the visitors active right now, a 24-hour sparkline, and unique visitors, sessions, pageviews, and views per session for the last 24 hours. Click it to open [All sites](/help/site-details).
Next to it, one card per pinned site shows that site's 24-hour visitors and trend. Pin sites from the **+** card or from the [Sites page](/help/sites); the card menu unpins them. Until you register a site, the tab shows a shortcut to web analytics.
The sections below describe the **Funnels** tab.
## Metrics
The top of the page shows four metrics. The selected metric is rendered as a large trend chart, and the other three appear as smaller cards with sparklines. Click any small card to promote it to the large chart.
| Metric | What it tells you |
| - | - |
| **Active identities** | People or anonymous visitors who did something in this period. |
| **Total events** | Every action tracked in this period, from known users and anonymous visitors. |
| **Events per identity** | How much a single identity does in this period, shown as both average and median. A wide gap between the two means a few power users pull the average up. |
| **Single-event rate** | Share of people who showed up once and never came back. Lower is better. |
When [period comparison](#date-range-picker) is turned on, each metric also shows a delta badge against the previous period.
## Cards
Below the metrics you'll find a set of cards that link deeper into the app:
The **All sites** card combines every hostname the project receives pageviews from: the visitors active right now, a 24-hour sparkline, and unique visitors, sessions, pageviews, and views per session for the last 24 hours. Click it to open [All sites](/help/site-details).
Next to it, one card per pinned site shows that site's 24-hour visitors and trend. Pin sites from the **+** card or from the [Sites page](/help/sites); the card menu unpins them. Until you register a site, the tab shows a shortcut to web analytics.
The sections below describe the **Funnels** tab.
## Metrics
The top of the page shows four metrics. The selected metric is rendered as a large trend chart, and the other three appear as smaller cards with sparklines. Click any small card to promote it to the large chart.
| Metric | What it tells you |
| - | - |
| **Active identities** | People or anonymous visitors who did something in this period. |
| **Total events** | Every action tracked in this period, from known users and anonymous visitors. |
| **Events per identity** | How much a single identity does in this period, shown as both average and median. A wide gap between the two means a few power users pull the average up. |
| **Single-event rate** | Share of people who showed up once and never came back. Lower is better. |
When [period comparison](#date-range-picker) is turned on, each metric also shows a delta badge against the previous period.
## Cards
Below the metrics you'll find a set of cards that link deeper into the app:
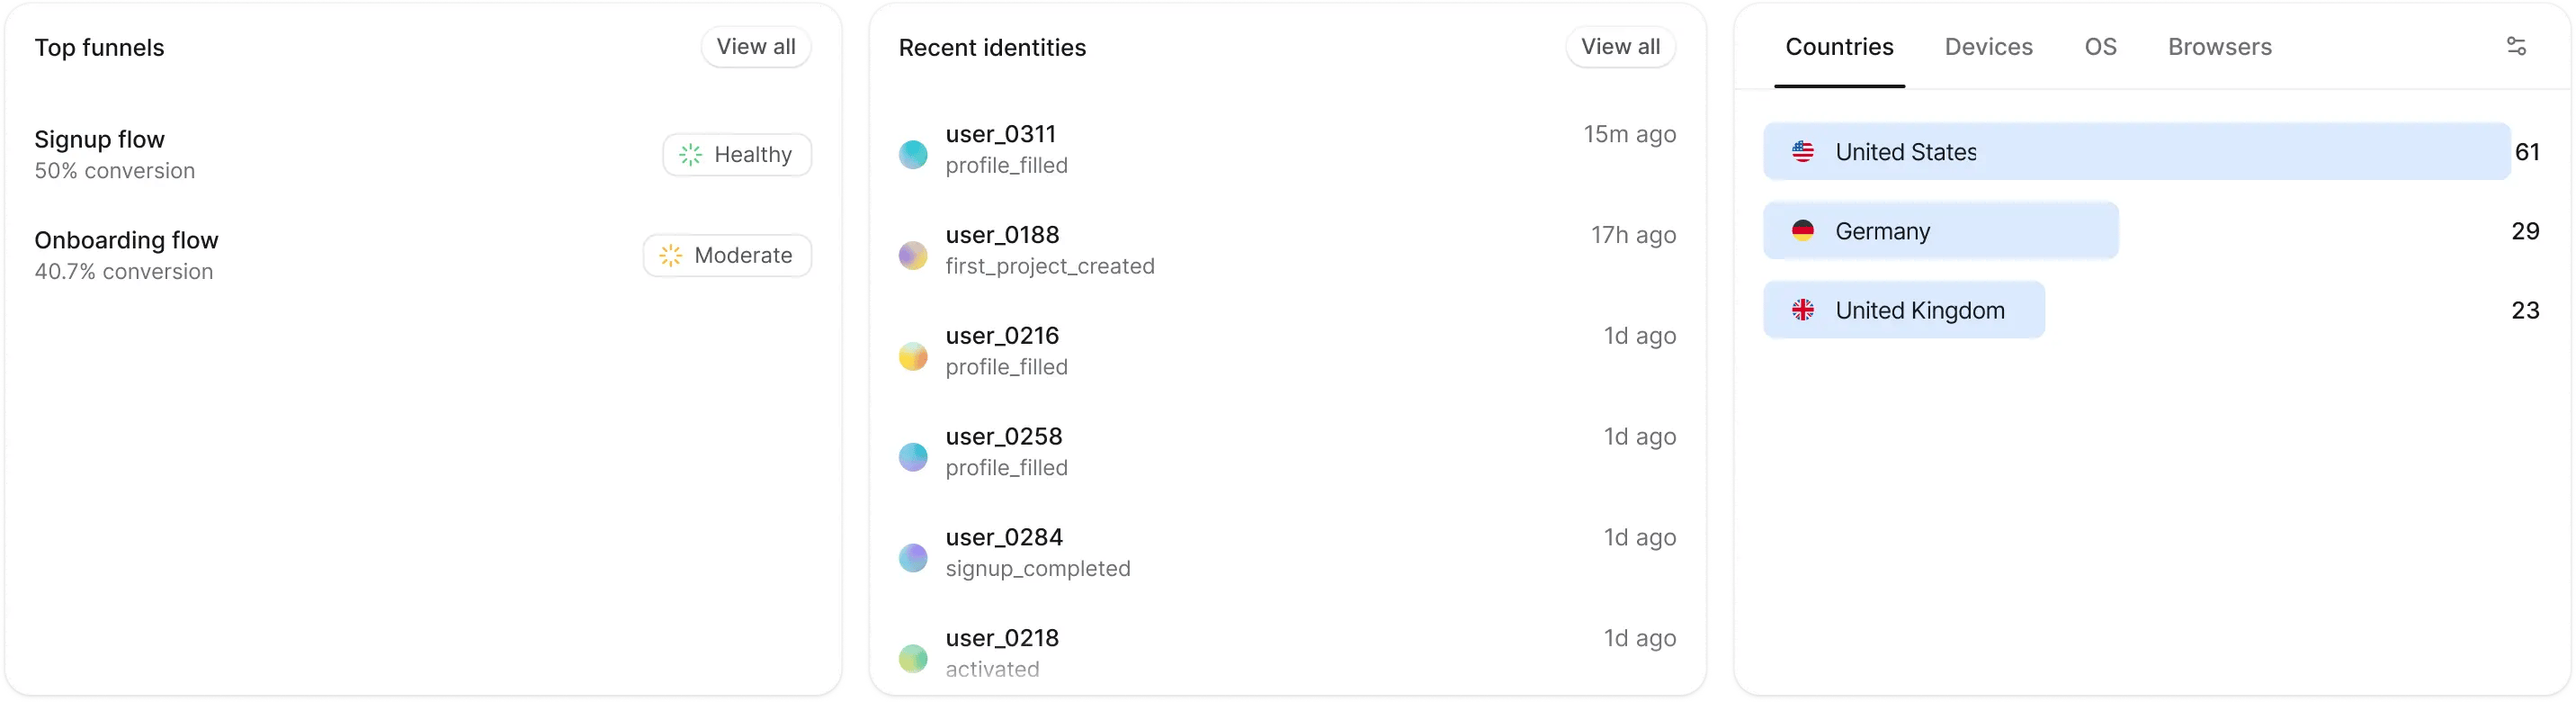 * **Recent events** shows the latest event batches and their delivery status. **View all** takes you to the Events page.
* **Top funnels** lists your funnels sorted by largest drop-off, each with its conversion rate and a [health indicator](/help/funnels#funnel-health). Hover the indicator for the verdict and what changed. **View all** takes you to the Funnels page.
* **Recent identities** shows the most recently seen users and their last step. Clicking one opens that user on the Users page.
* **Segment breakdown** splits your identities across a dimension. The default tabs are **Countries**, **Devices**, **OS**, and **Browsers**.
The gear icon on the segment breakdown card lets you add any other dimension
as an extra tab: Country, City, Device type, Browser, Operating system, Plan,
Source, Identity, Lifecycle, Engagement, Referrer, Landing page, Environment,
SDK version, or any user trait you send with `identify()`.
## Filtering data
The filter bar sits at the top left of the page. Until you add a filter it reads "All identities and events".
* **Recent events** shows the latest event batches and their delivery status. **View all** takes you to the Events page.
* **Top funnels** lists your funnels sorted by largest drop-off, each with its conversion rate and a [health indicator](/help/funnels#funnel-health). Hover the indicator for the verdict and what changed. **View all** takes you to the Funnels page.
* **Recent identities** shows the most recently seen users and their last step. Clicking one opens that user on the Users page.
* **Segment breakdown** splits your identities across a dimension. The default tabs are **Countries**, **Devices**, **OS**, and **Browsers**.
The gear icon on the segment breakdown card lets you add any other dimension
as an extra tab: Country, City, Device type, Browser, Operating system, Plan,
Source, Identity, Lifecycle, Engagement, Referrer, Landing page, Environment,
SDK version, or any user trait you send with `identify()`.
## Filtering data
The filter bar sits at the top left of the page. Until you add a filter it reads "All identities and events".
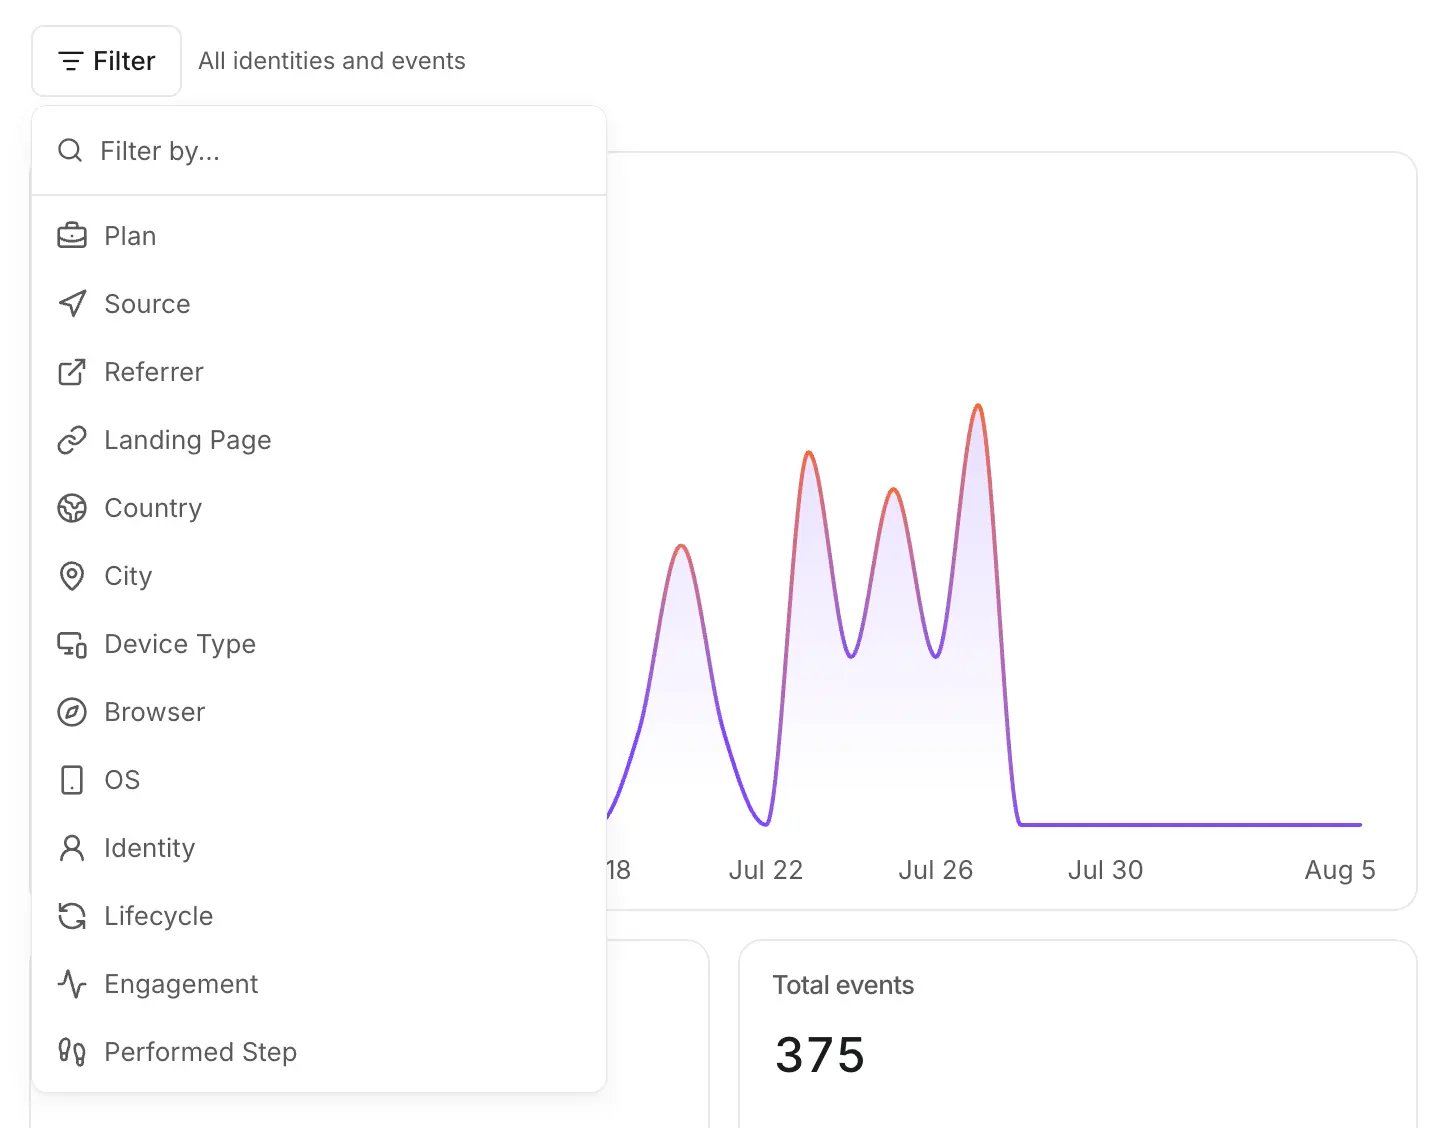 You can filter by:
* **Plan** and **Source**, from the traits you send with `identify()`
* **Referrer** and **Landing page**
* **Country** and **City**
* **Device type**, **Browser**, and **OS**
* **Identity**: identified users vs anonymous sessions
* **Lifecycle**: new vs returning identities
* **Engagement**: single-event vs engaged identities
* **Performed step** and **Did not perform step**, to include or exclude people based on funnel steps
* **Environment** and **SDK version**
* **User trait** and **Event property**, for anything custom you track
Trait and property filters support both positive and negative matching: **is** / **is any of**, and **is not** / **is none of**. You can combine up to 10 trait or property filters, with up to 20 values each.
## Date range picker
The date range picker sits at the top right. It defaults to **Last 30 days**.
You can filter by:
* **Plan** and **Source**, from the traits you send with `identify()`
* **Referrer** and **Landing page**
* **Country** and **City**
* **Device type**, **Browser**, and **OS**
* **Identity**: identified users vs anonymous sessions
* **Lifecycle**: new vs returning identities
* **Engagement**: single-event vs engaged identities
* **Performed step** and **Did not perform step**, to include or exclude people based on funnel steps
* **Environment** and **SDK version**
* **User trait** and **Event property**, for anything custom you track
Trait and property filters support both positive and negative matching: **is** / **is any of**, and **is not** / **is none of**. You can combine up to 10 trait or property filters, with up to 20 values each.
## Date range picker
The date range picker sits at the top right. It defaults to **Last 30 days**.
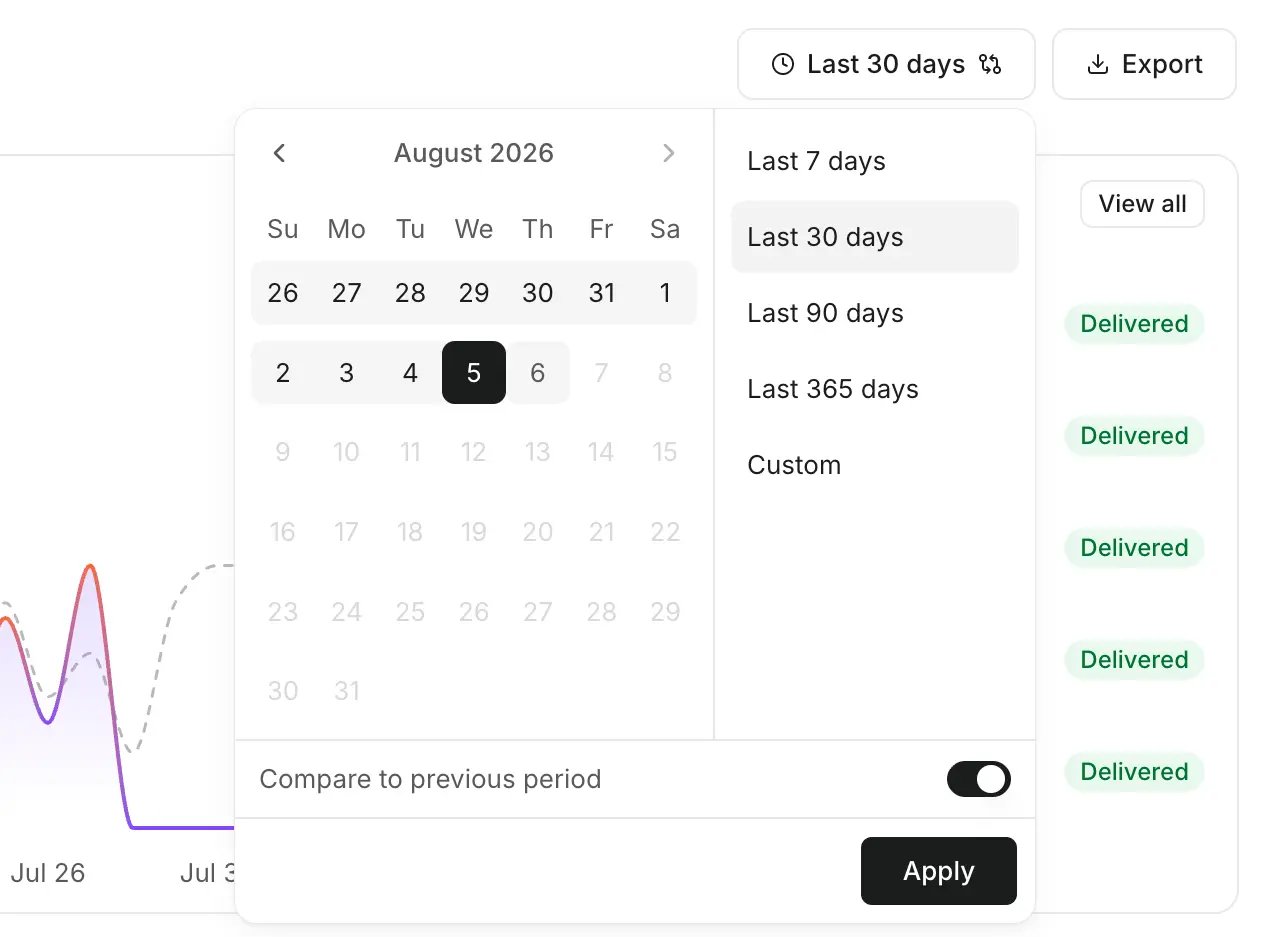 * Presets: **Last 7 days**, **Last 30 days**, **Last 90 days**, **Last 365 days**, or **Custom** with a range calendar.
* **Compare to previous period** adds a comparison line to the trend chart and delta badges to every metric and card.
Presets longer than your plan's [data retention](/help/plans#data-retention)
are locked. Upgrade your plan to unlock longer date ranges.
## Exporting your data
The **Export** button downloads your overview data as CSV:
* **Trend over time**: users and events per day, week, or month
* **Segment breakdown**: users and engagement by the selected dimension
This is useful when you want to analyze the data in a spreadsheet or BI tool, or share it with your team.
This documentation is built and hosted on [Mintlify](https://mintlify.com), a developer documentation platform.
* Presets: **Last 7 days**, **Last 30 days**, **Last 90 days**, **Last 365 days**, or **Custom** with a range calendar.
* **Compare to previous period** adds a comparison line to the trend chart and delta badges to every metric and card.
Presets longer than your plan's [data retention](/help/plans#data-retention)
are locked. Upgrade your plan to unlock longer date ranges.
## Exporting your data
The **Export** button downloads your overview data as CSV:
* **Trend over time**: users and events per day, week, or month
* **Segment breakdown**: users and engagement by the selected dimension
This is useful when you want to analyze the data in a spreadsheet or BI tool, or share it with your team.
This documentation is built and hosted on [Mintlify](https://mintlify.com), a developer documentation platform.