> ## Documentation Index
> Fetch the complete documentation index at: https://docs.wendung.app/llms.txt
> Use this file to discover all available pages before exploring further.
# Site details
> Read a site's traffic: visitors, sessions, pages, sources, locations, and devices, with filters and comparison.
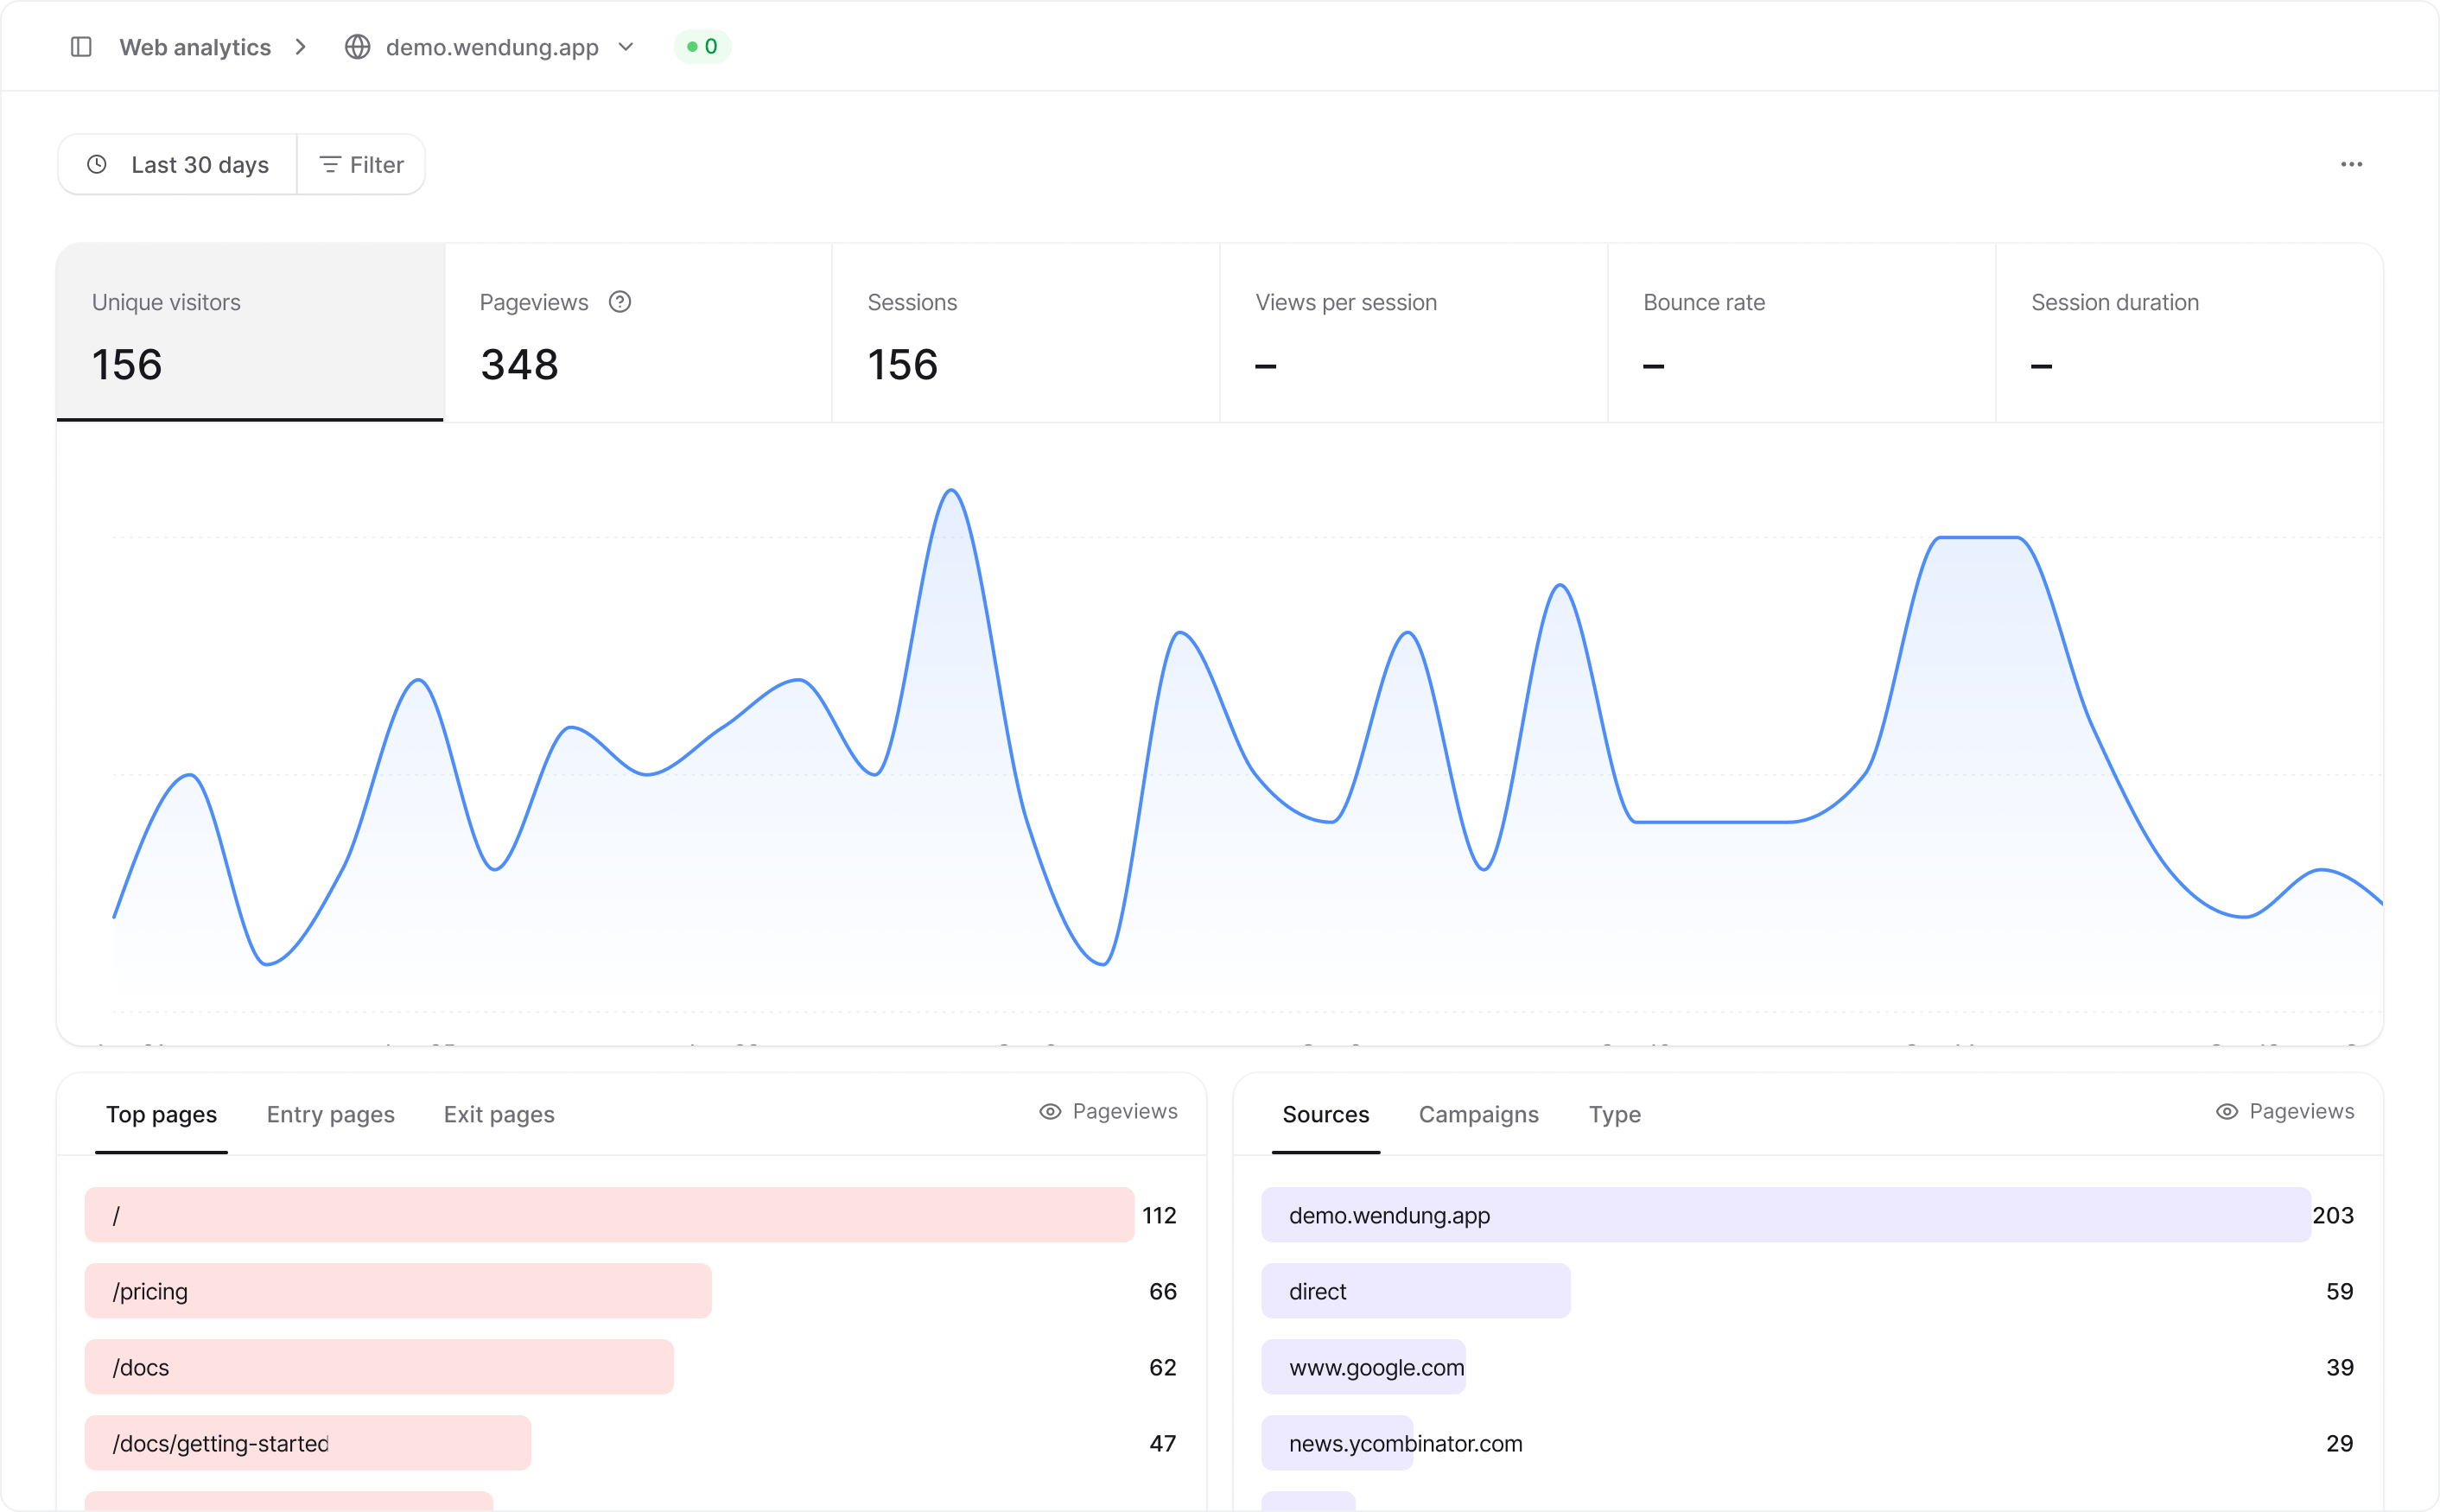
The site page is the web analytics dashboard for one hostname, or for all of them when you open **All sites**. The breadcrumb at the top switches between sites, and the green badge next to the name counts visitors active in the last five minutes.
 ## Metrics and chart
The rail shows six metrics for the selected range. Click one to chart it below. Pageviews include aggregate and consented traffic. All visitor, session, and engagement metrics cover consented traffic only. The question-mark icon beside **Pageviews** explains this difference.
| Metric | What it counts |
| - | - |
| **Unique visitors** | Distinct visitors, by the anonymous ID the SDK keeps in their browser. |
| **Pageviews** | Every pageview, including repeat views of the same page. |
| **Sessions** | Visits, closed after 30 minutes without activity. |
| **Views per session** | Consented pageviews divided by sessions. |
| **Bounce rate** | Share of sessions with a single pageview. |
| **Session duration** | Average time between a session's first and last pageview. |
Views per session, bounce rate, and session duration come from session data that is rebuilt once an hour, so they can trail visitors and pageviews by up to an hour. With **Compare to previous period** on, each metric gets a badge with its change: green when the move is good, red when it is not (a rising bounce rate is red), and a gray **New** when the previous period had no data. The chart adds a dashed line for the previous range. Ranges up to two days are charted per hour; longer ranges per day, week, or month.
## Panels
Four panels rank the traffic. Each has tabs, an indicator in its header naming the number in the rows (pageviews, or sessions for entry and exit pages), and a **View all** button that opens the full list with a search box.
| Panel | Tabs |
| - | - |
| **Pages** | Top pages, Entry pages, Exit pages. Entry and exit rows also show bounce rate and average session duration. |
| **Sources** | Sources (referrer domains), Campaigns (UTM campaign, source, or medium, taken from the `utm_*` parameters on the link that started the session), Type (direct, search, social, email, referral, internal). |
| **Locations** | Countries, Cities. |
| **Devices** | Device type, Browser, OS. |
## Metrics and chart
The rail shows six metrics for the selected range. Click one to chart it below. Pageviews include aggregate and consented traffic. All visitor, session, and engagement metrics cover consented traffic only. The question-mark icon beside **Pageviews** explains this difference.
| Metric | What it counts |
| - | - |
| **Unique visitors** | Distinct visitors, by the anonymous ID the SDK keeps in their browser. |
| **Pageviews** | Every pageview, including repeat views of the same page. |
| **Sessions** | Visits, closed after 30 minutes without activity. |
| **Views per session** | Consented pageviews divided by sessions. |
| **Bounce rate** | Share of sessions with a single pageview. |
| **Session duration** | Average time between a session's first and last pageview. |
Views per session, bounce rate, and session duration come from session data that is rebuilt once an hour, so they can trail visitors and pageviews by up to an hour. With **Compare to previous period** on, each metric gets a badge with its change: green when the move is good, red when it is not (a rising bounce rate is red), and a gray **New** when the previous period had no data. The chart adds a dashed line for the previous range. Ranges up to two days are charted per hour; longer ranges per day, week, or month.
## Panels
Four panels rank the traffic. Each has tabs, an indicator in its header naming the number in the rows (pageviews, or sessions for entry and exit pages), and a **View all** button that opens the full list with a search box.
| Panel | Tabs |
| - | - |
| **Pages** | Top pages, Entry pages, Exit pages. Entry and exit rows also show bounce rate and average session duration. |
| **Sources** | Sources (referrer domains), Campaigns (UTM campaign, source, or medium, taken from the `utm_*` parameters on the link that started the session), Type (direct, search, social, email, referral, internal). |
| **Locations** | Countries, Cities. |
| **Devices** | Device type, Browser, OS. |
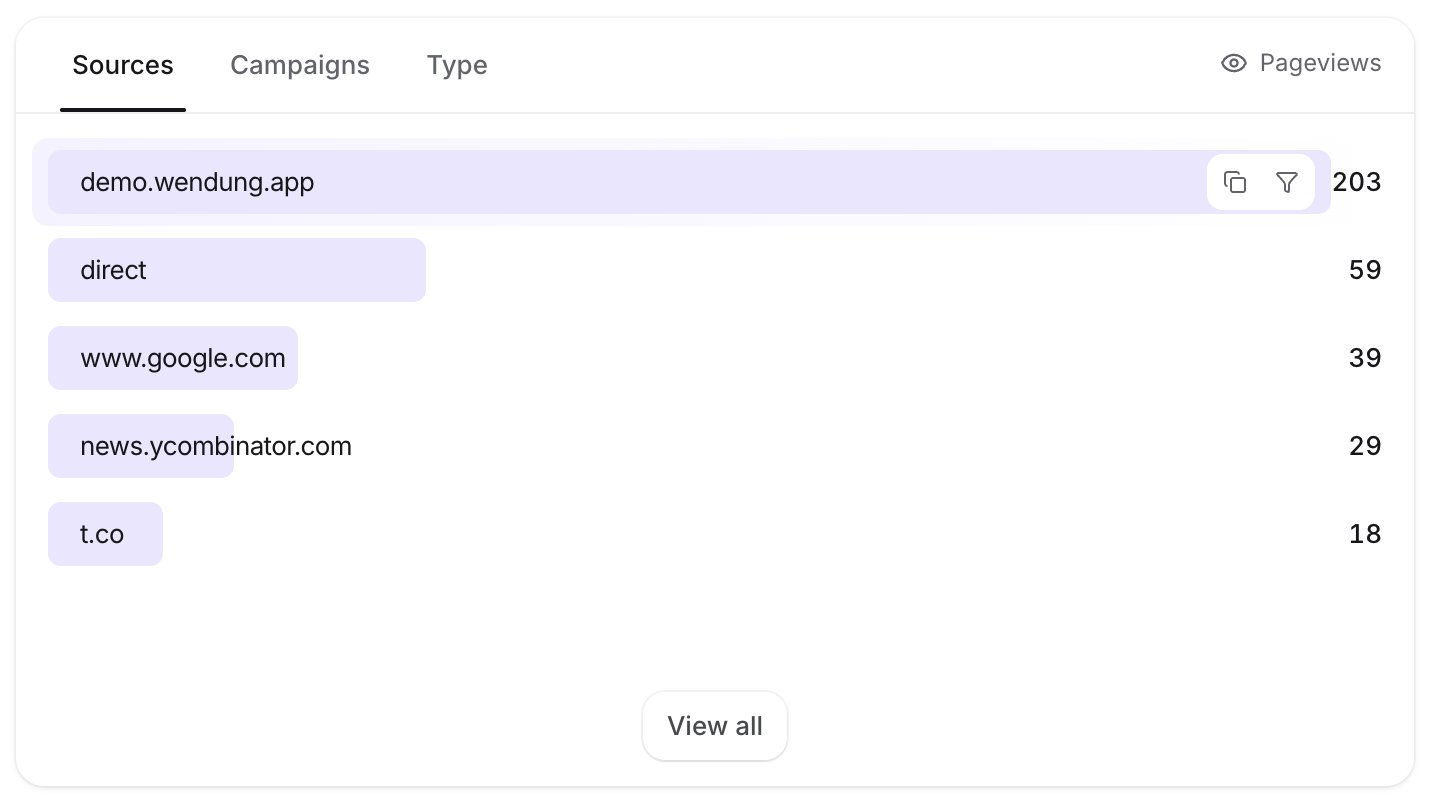 Hover a row to reveal two actions: copy the value, and filter by it. Clicking the row does the same as the filter action. A row that is currently a filter shows a remove-filter action instead, and clicking it clears the filter.
Paths in the Pages panel are normalized, so `/users/123` and `/users/456` appear as one row `/users/:id`. See [site settings](/help/site-settings) to change how paths are collapsed.
## Filters and date range
The filter bar accepts every dimension the panels show: hostname (on **All sites**), page, source, channel type, UTM fields, country, city, device type, browser, and OS. Each filter can be **is** or **is not**, with several values. Filters, the date range, and the selected metric are part of the URL, so a view can be shared as a link.
The date range picker has the presets from the rest of the app plus **Today** and **Last 24 hours**, which chart per hour. Presets beyond your plan's [data retention](/help/plans#data-retention) are locked.
## Exporting
**Export** downloads a CSV of the summary metrics, the top pages, or the sources, with the active filters and range applied.
This documentation is built and hosted on [Mintlify](https://mintlify.com), a developer documentation platform.
Hover a row to reveal two actions: copy the value, and filter by it. Clicking the row does the same as the filter action. A row that is currently a filter shows a remove-filter action instead, and clicking it clears the filter.
Paths in the Pages panel are normalized, so `/users/123` and `/users/456` appear as one row `/users/:id`. See [site settings](/help/site-settings) to change how paths are collapsed.
## Filters and date range
The filter bar accepts every dimension the panels show: hostname (on **All sites**), page, source, channel type, UTM fields, country, city, device type, browser, and OS. Each filter can be **is** or **is not**, with several values. Filters, the date range, and the selected metric are part of the URL, so a view can be shared as a link.
The date range picker has the presets from the rest of the app plus **Today** and **Last 24 hours**, which chart per hour. Presets beyond your plan's [data retention](/help/plans#data-retention) are locked.
## Exporting
**Export** downloads a CSV of the summary metrics, the top pages, or the sources, with the active filters and range applied.
This documentation is built and hosted on [Mintlify](https://mintlify.com), a developer documentation platform.