
The request log
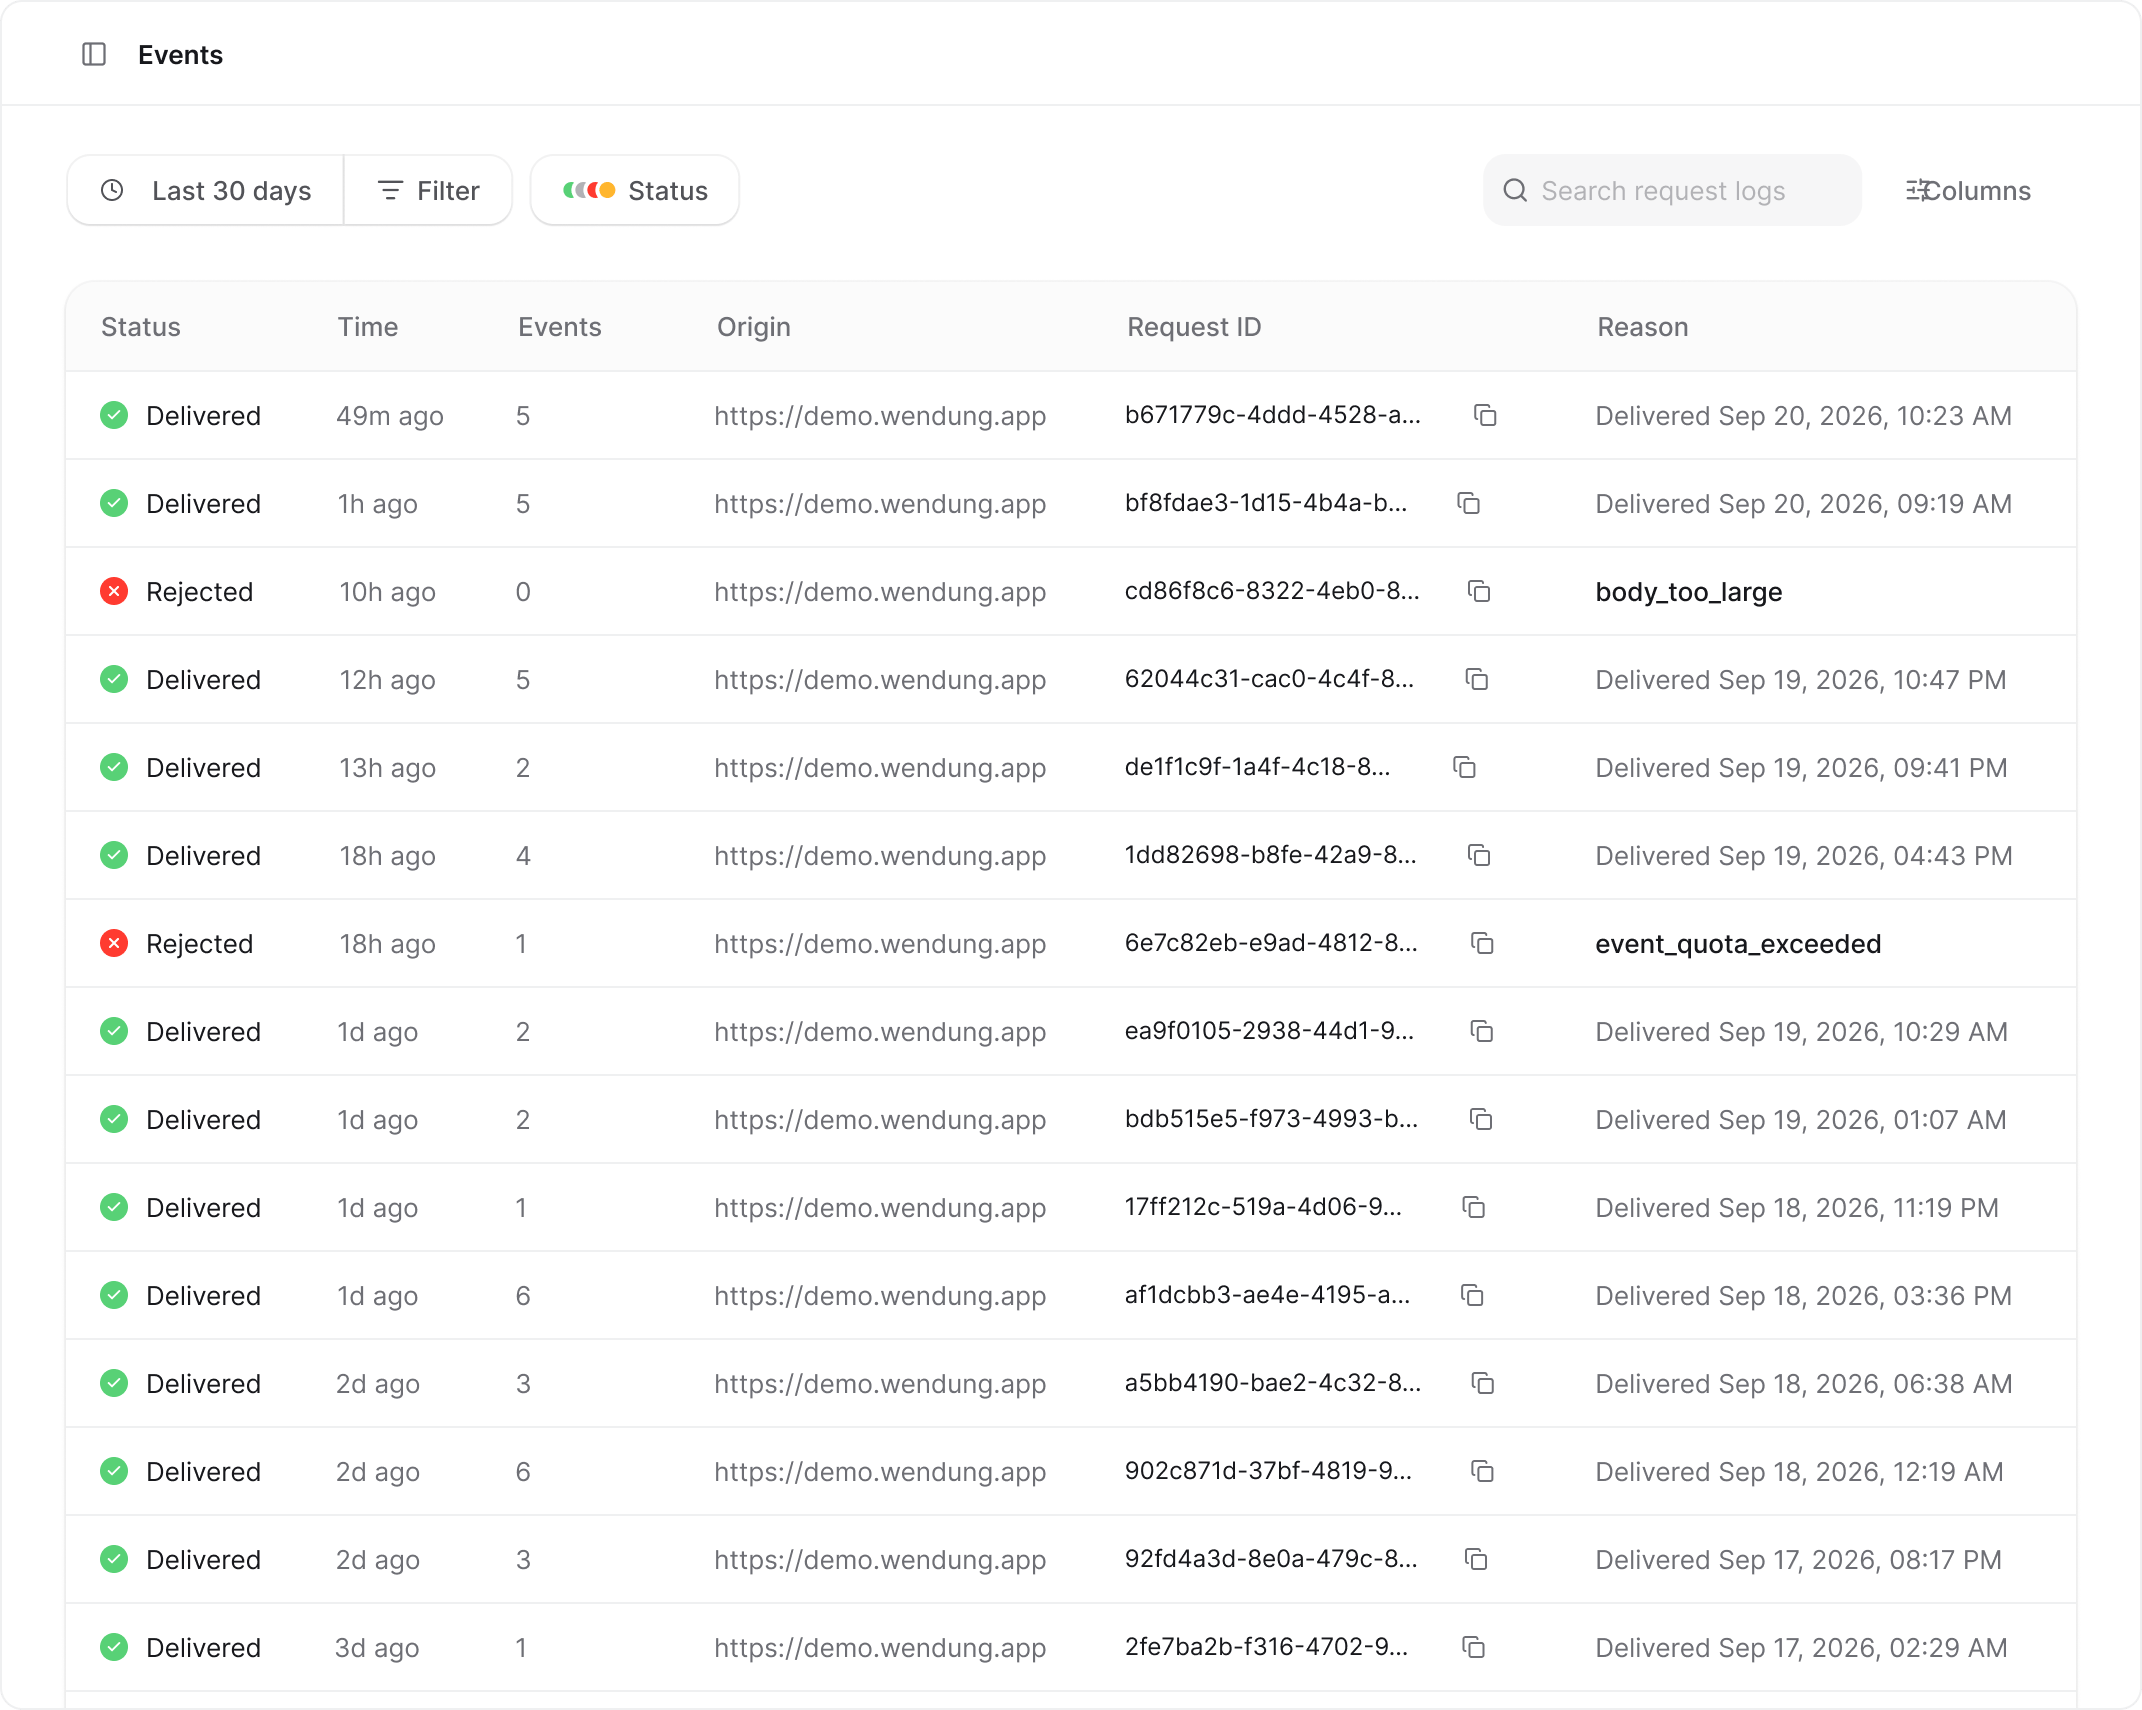
Each row is one request from the SDK, which can contain several events in a batch. The columns show the status, when the request arrived, how many events it carried, the origin it was sent from, a human-readable reason, and the request ID with a copy button. A request can have one of these statuses:Finding the right request
The toolbar gives you a few ways to narrow the log down:- Search across request logs
- The status select limits the list to one status, which makes “show me everything that failed” a one-click question
- Filters opens advanced filters for exact lookups: Request ID, Batch ID, Session ID, User ID hash, Origin, and SDK version
- The date range picker works like everywhere else in the app
- Columns lets you hide columns you don’t need
Request details
Click a row to open the full request log. This is the fastest way to answer “why didn’t this event show up”.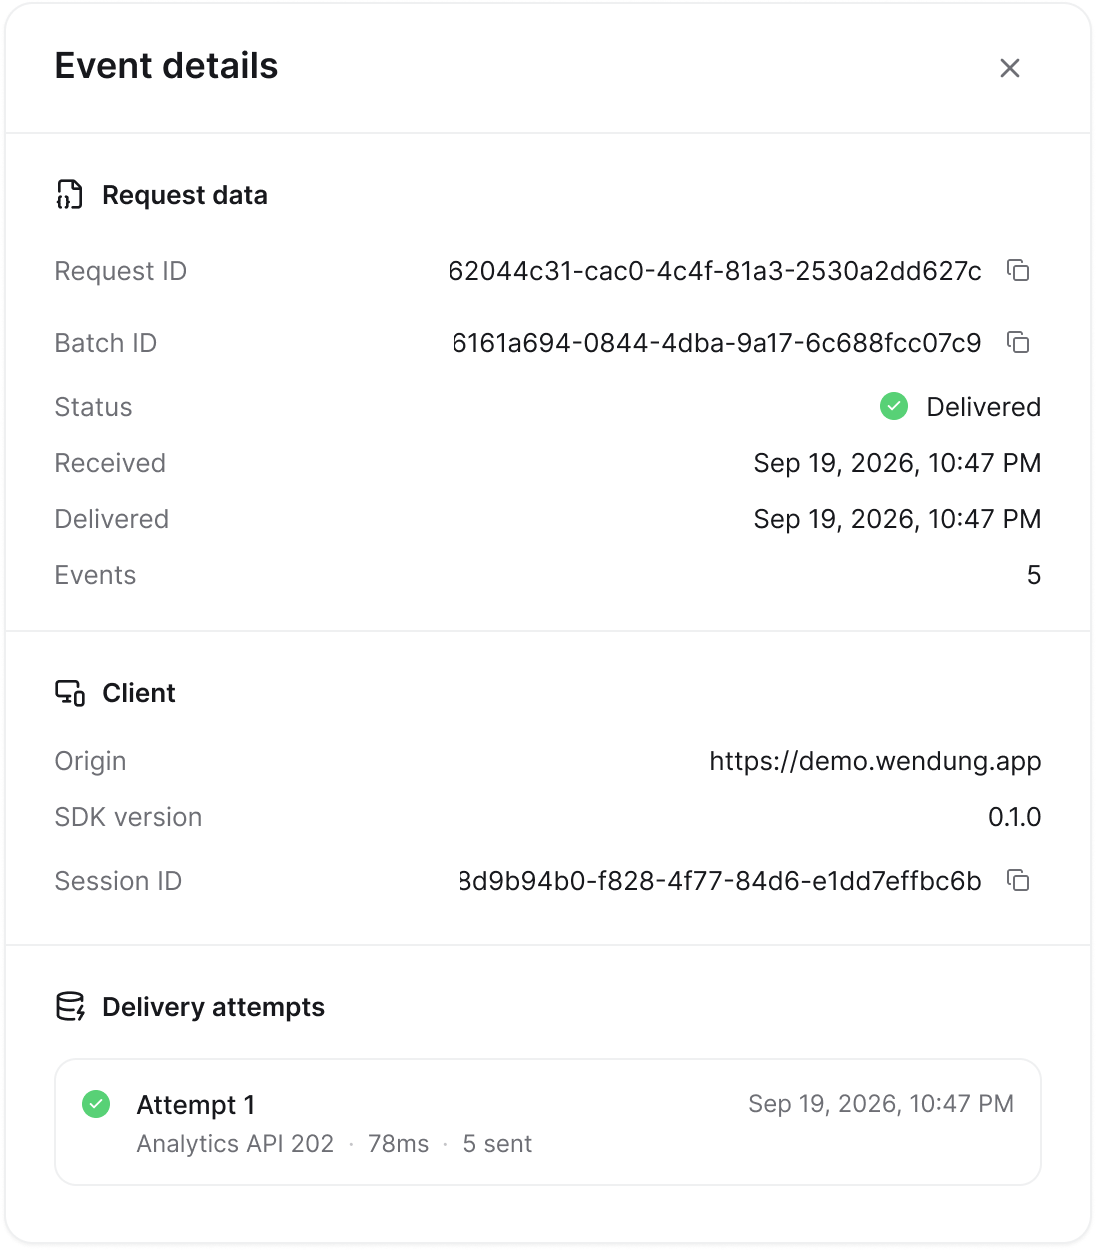
- Request: the request and batch IDs, status, when the request was received and delivered, and how many events it contained.
- Client: the origin the request came from, the SDK version, and the browser, OS, device type, and location when known.
- Payload summary: the session and user the events belong to, and what the batch contained.
rate_limited or event_quota_exceeded mean the project hit a plan limit rather than a technical problem.
Requests from an origin that isn’t on your allowed origins list are rejected.
If you see rejections right after a deploy, check Settings and add the
new domain to allowed origins. When the rejected origin is
localhost, turn
on Dev mode instead of adding it to the list.