
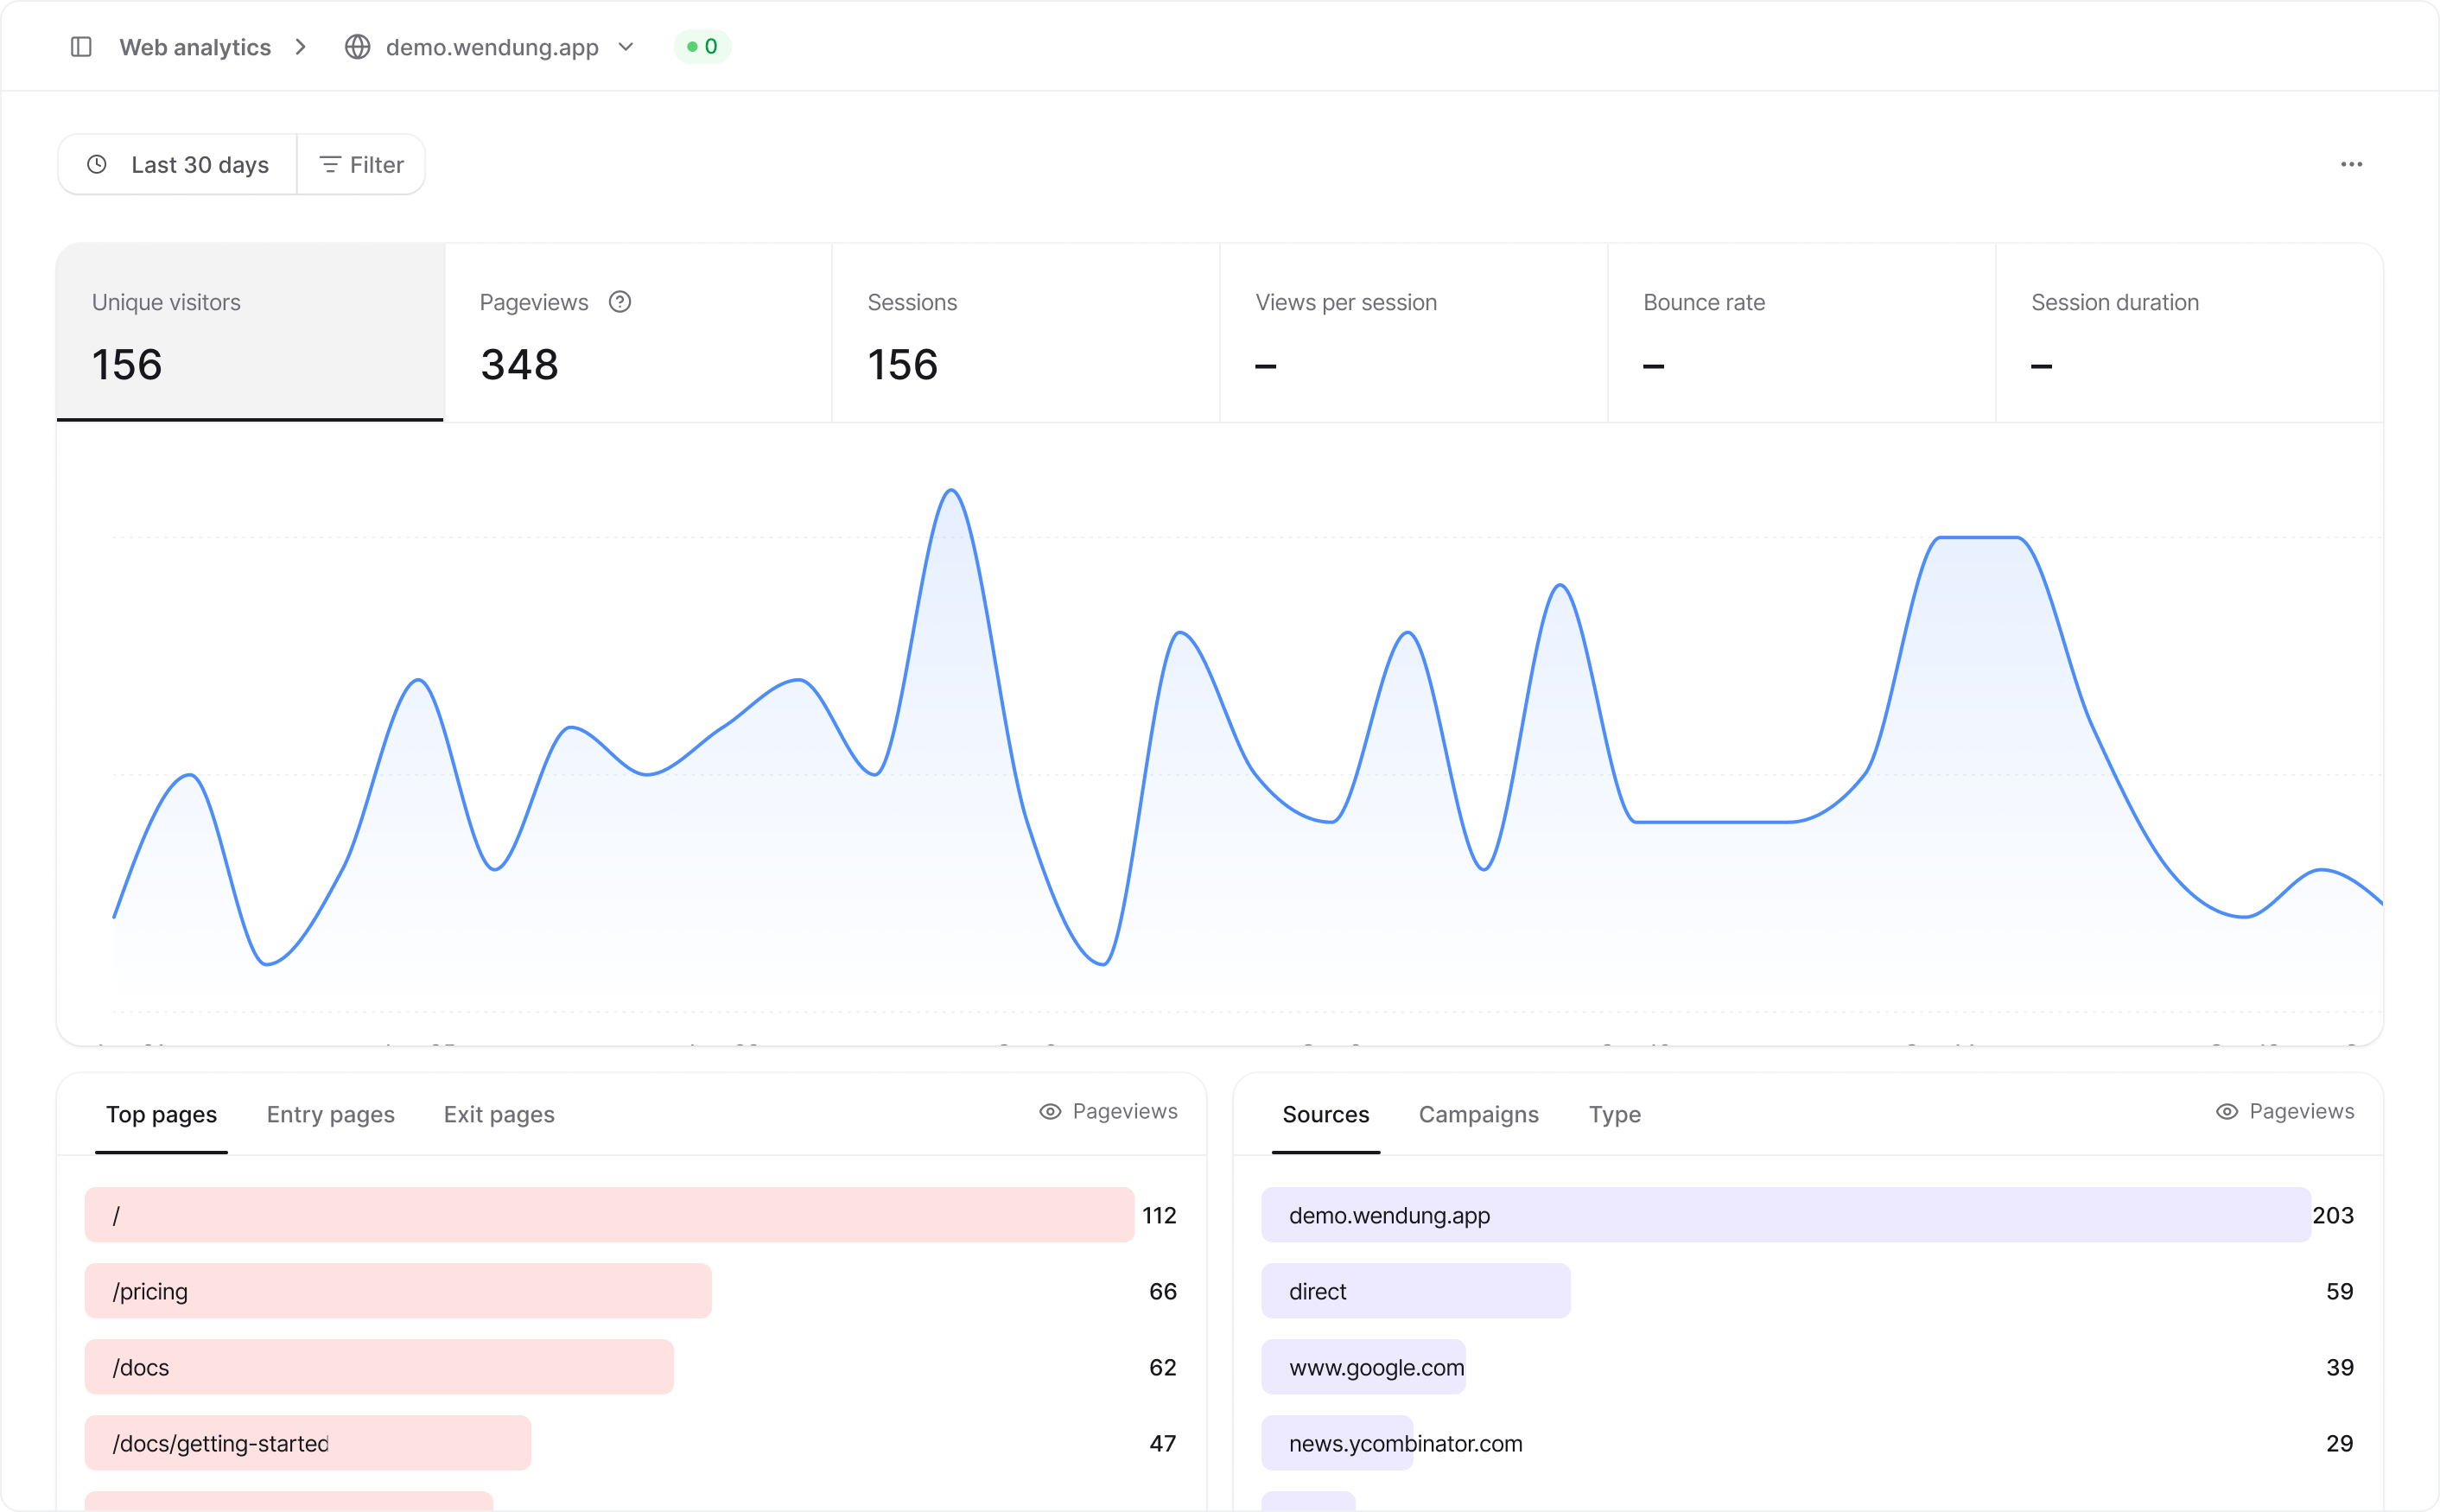
Metrics and chart
The rail shows six metrics for the selected range. Click one to chart it below. Pageviews include aggregate and consented traffic. All visitor, session, and engagement metrics cover consented traffic only. The question-mark icon beside Pageviews explains this difference.
Views per session, bounce rate, and session duration come from session data that is rebuilt once an hour, so they can trail visitors and pageviews by up to an hour. With Compare to previous period on, each metric gets a badge with its change: green when the move is good, red when it is not (a rising bounce rate is red), and a gray New when the previous period had no data. The chart adds a dashed line for the previous range. Ranges up to two days are charted per hour; longer ranges per day, week, or month.
Panels
Four panels rank the traffic. Each has tabs, an indicator in its header naming the number in the rows (pageviews, or sessions for entry and exit pages), and a View all button that opens the full list with a search box.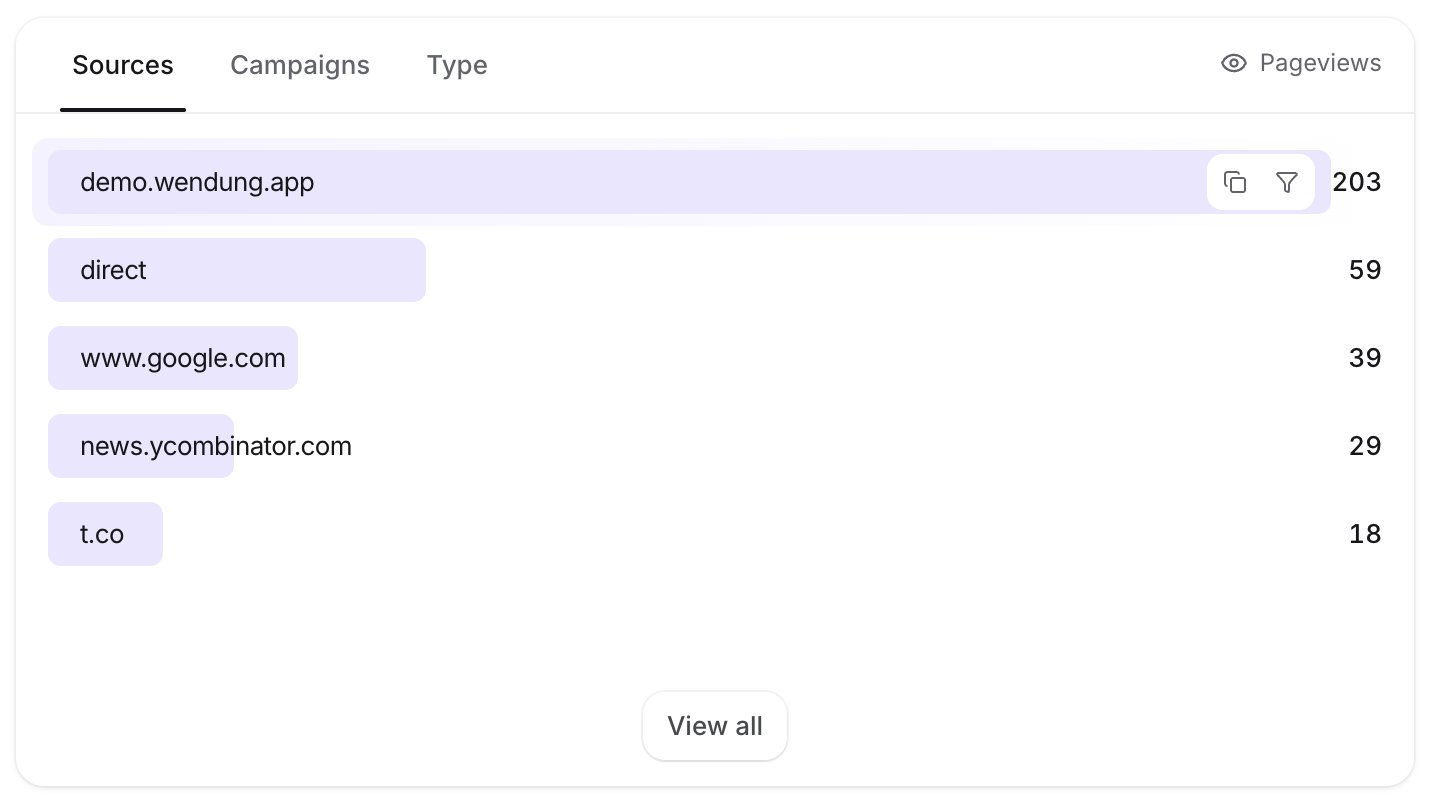
/users/123 and /users/456 appear as one row /users/:id. See site settings to change how paths are collapsed.