
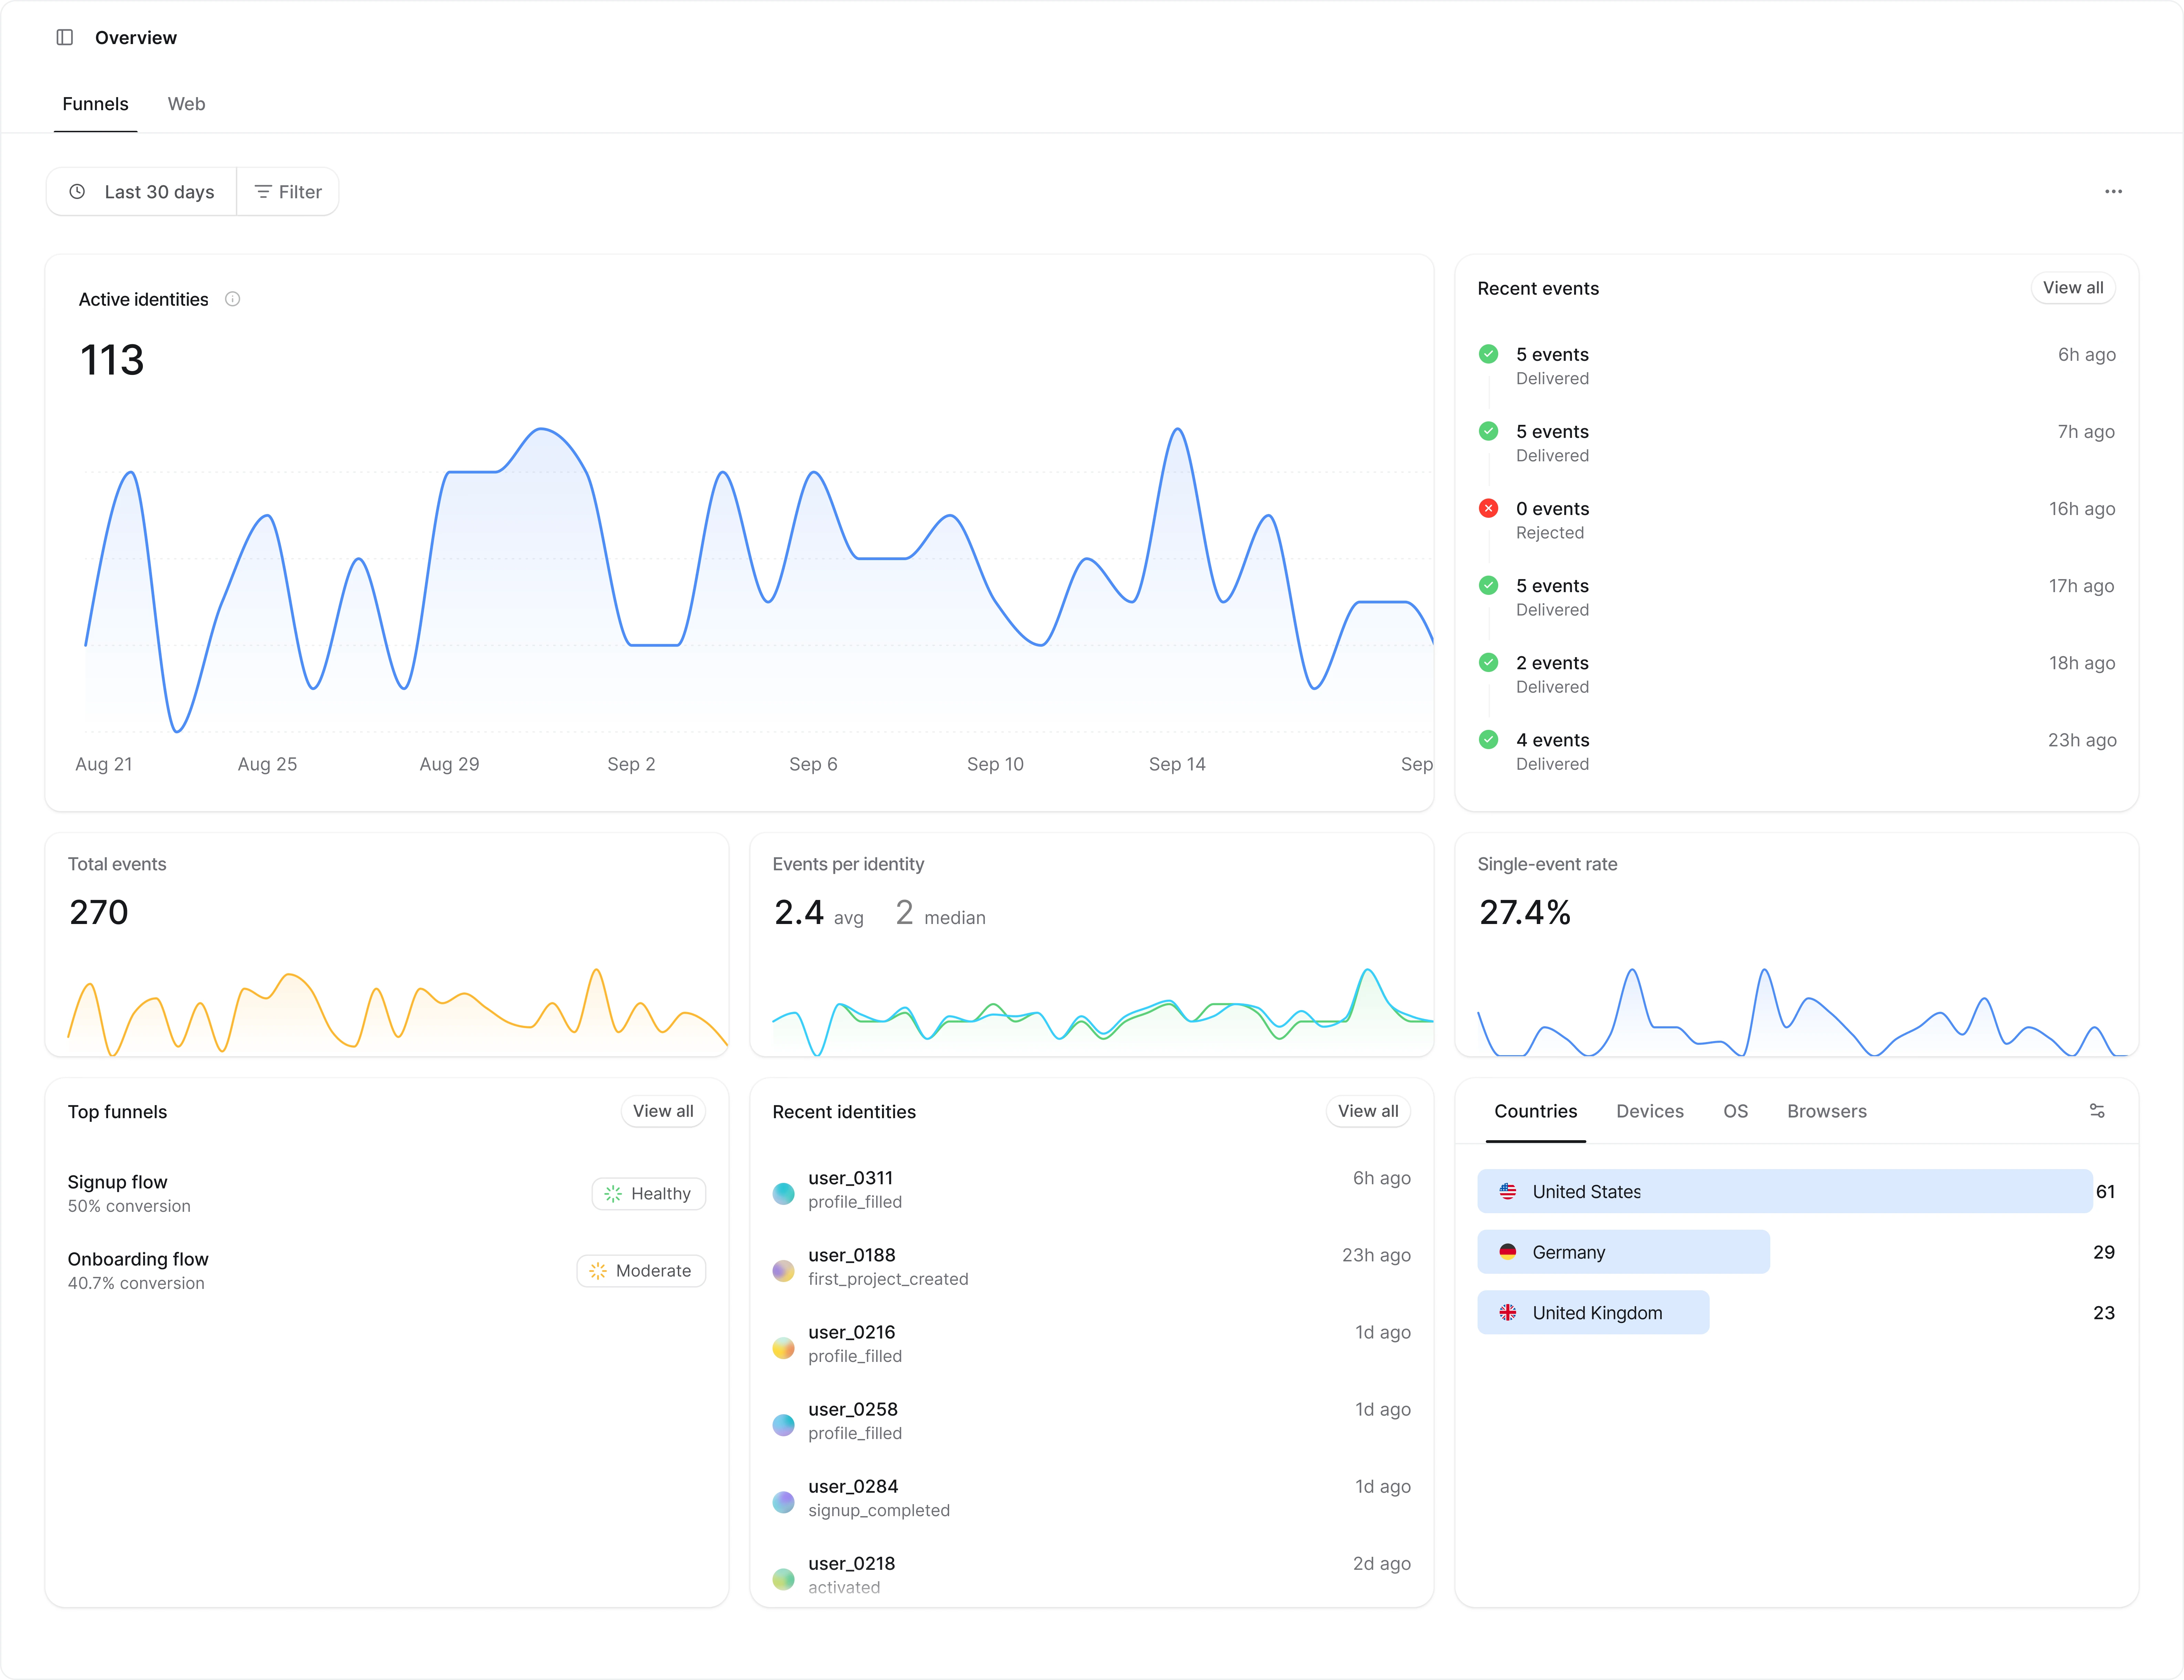
Web tab
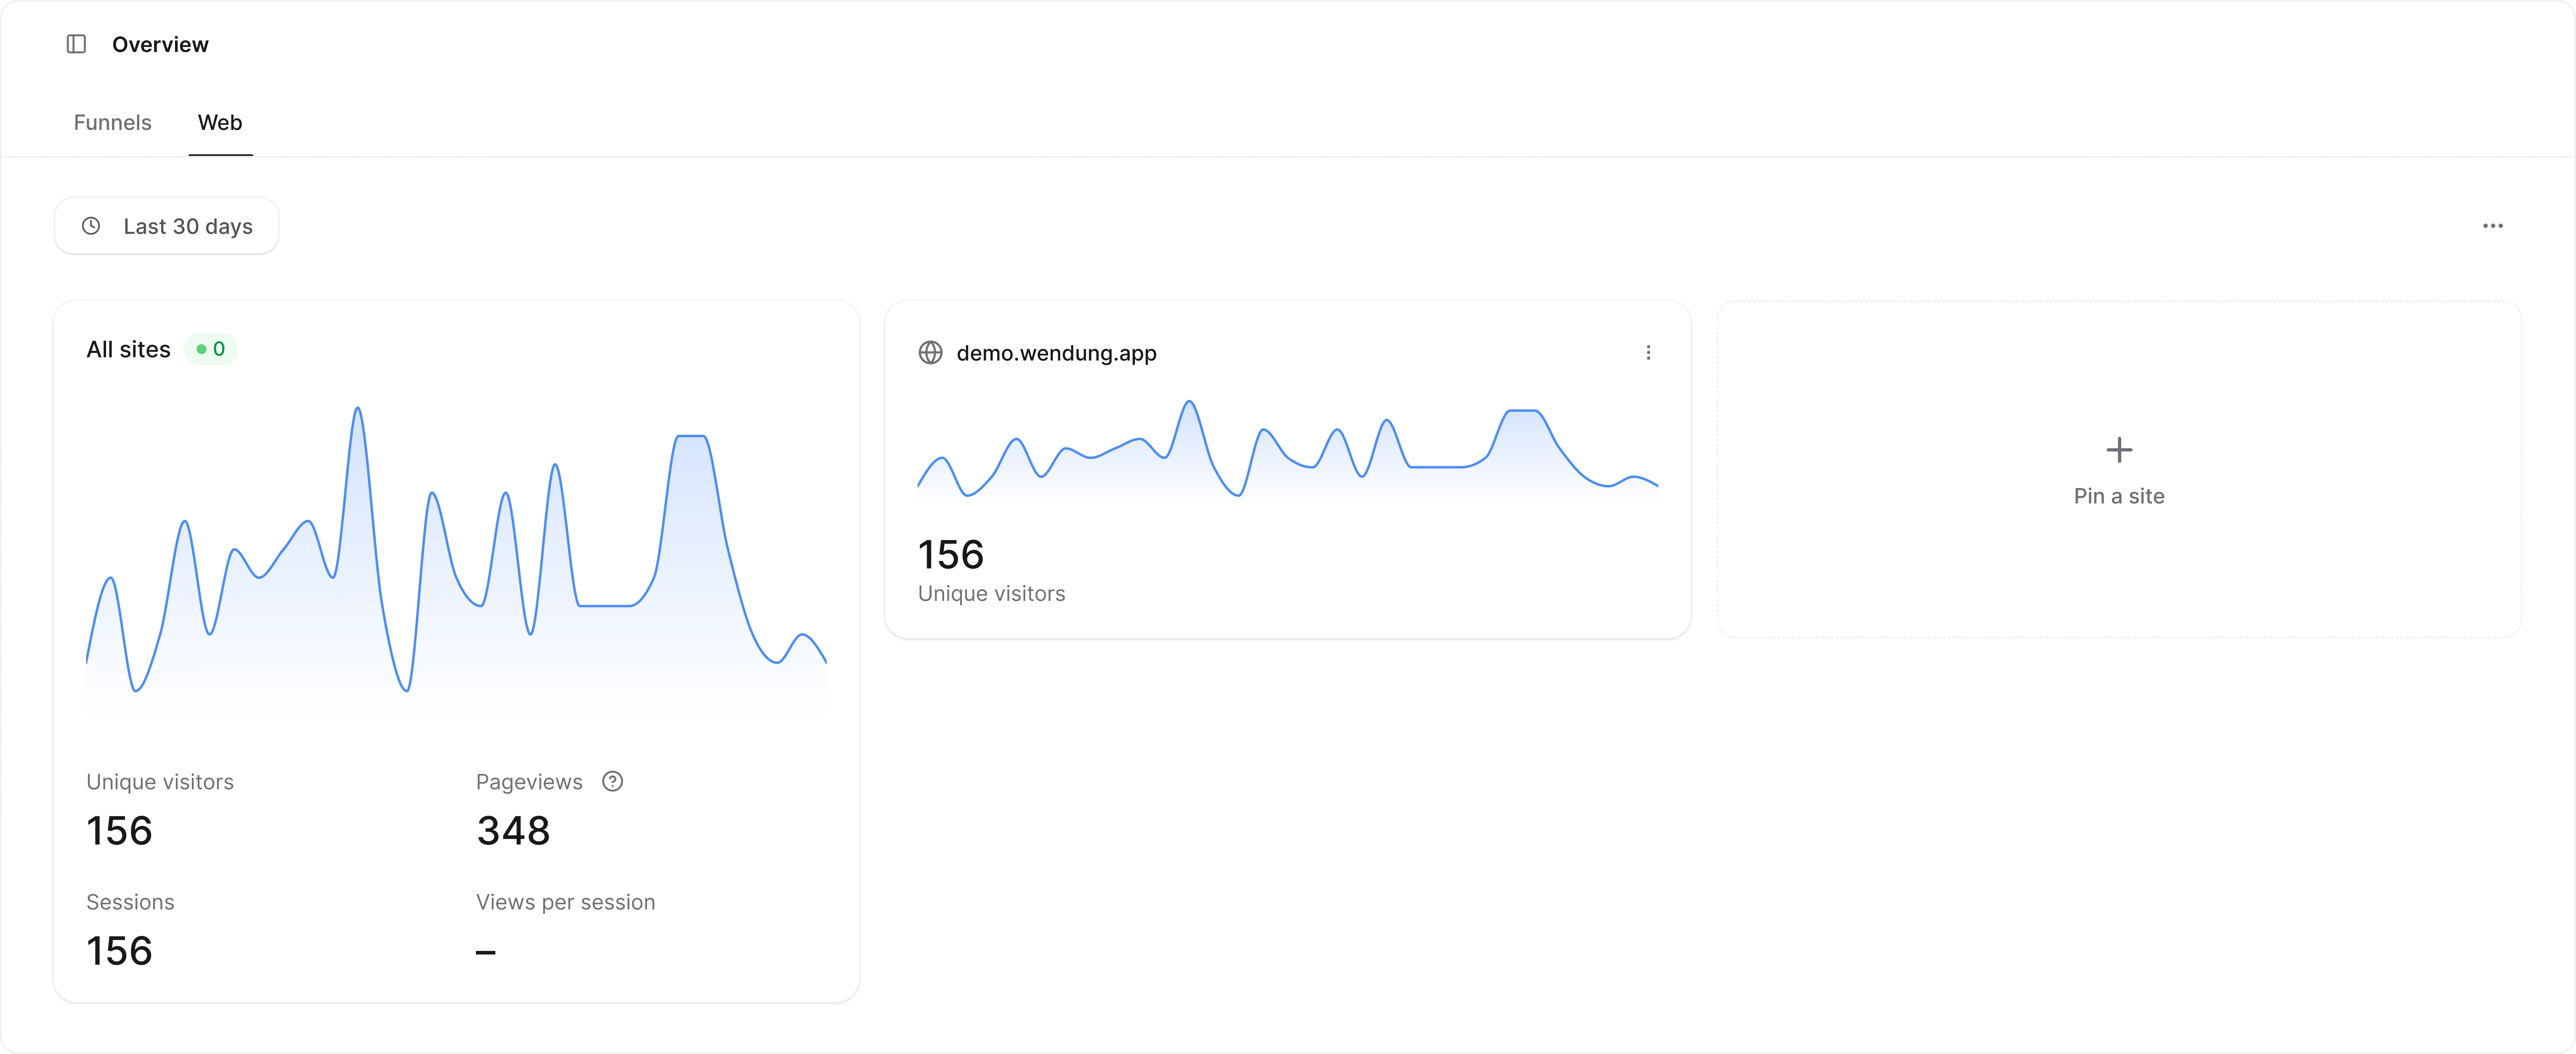
Metrics
The top of the page shows four metrics. The selected metric is rendered as a large trend chart, and the other three appear as smaller cards with sparklines. Click any small card to promote it to the large chart.
When period comparison is turned on, each metric also shows a delta badge against the previous period.
Cards
Below the metrics you’ll find a set of cards that link deeper into the app: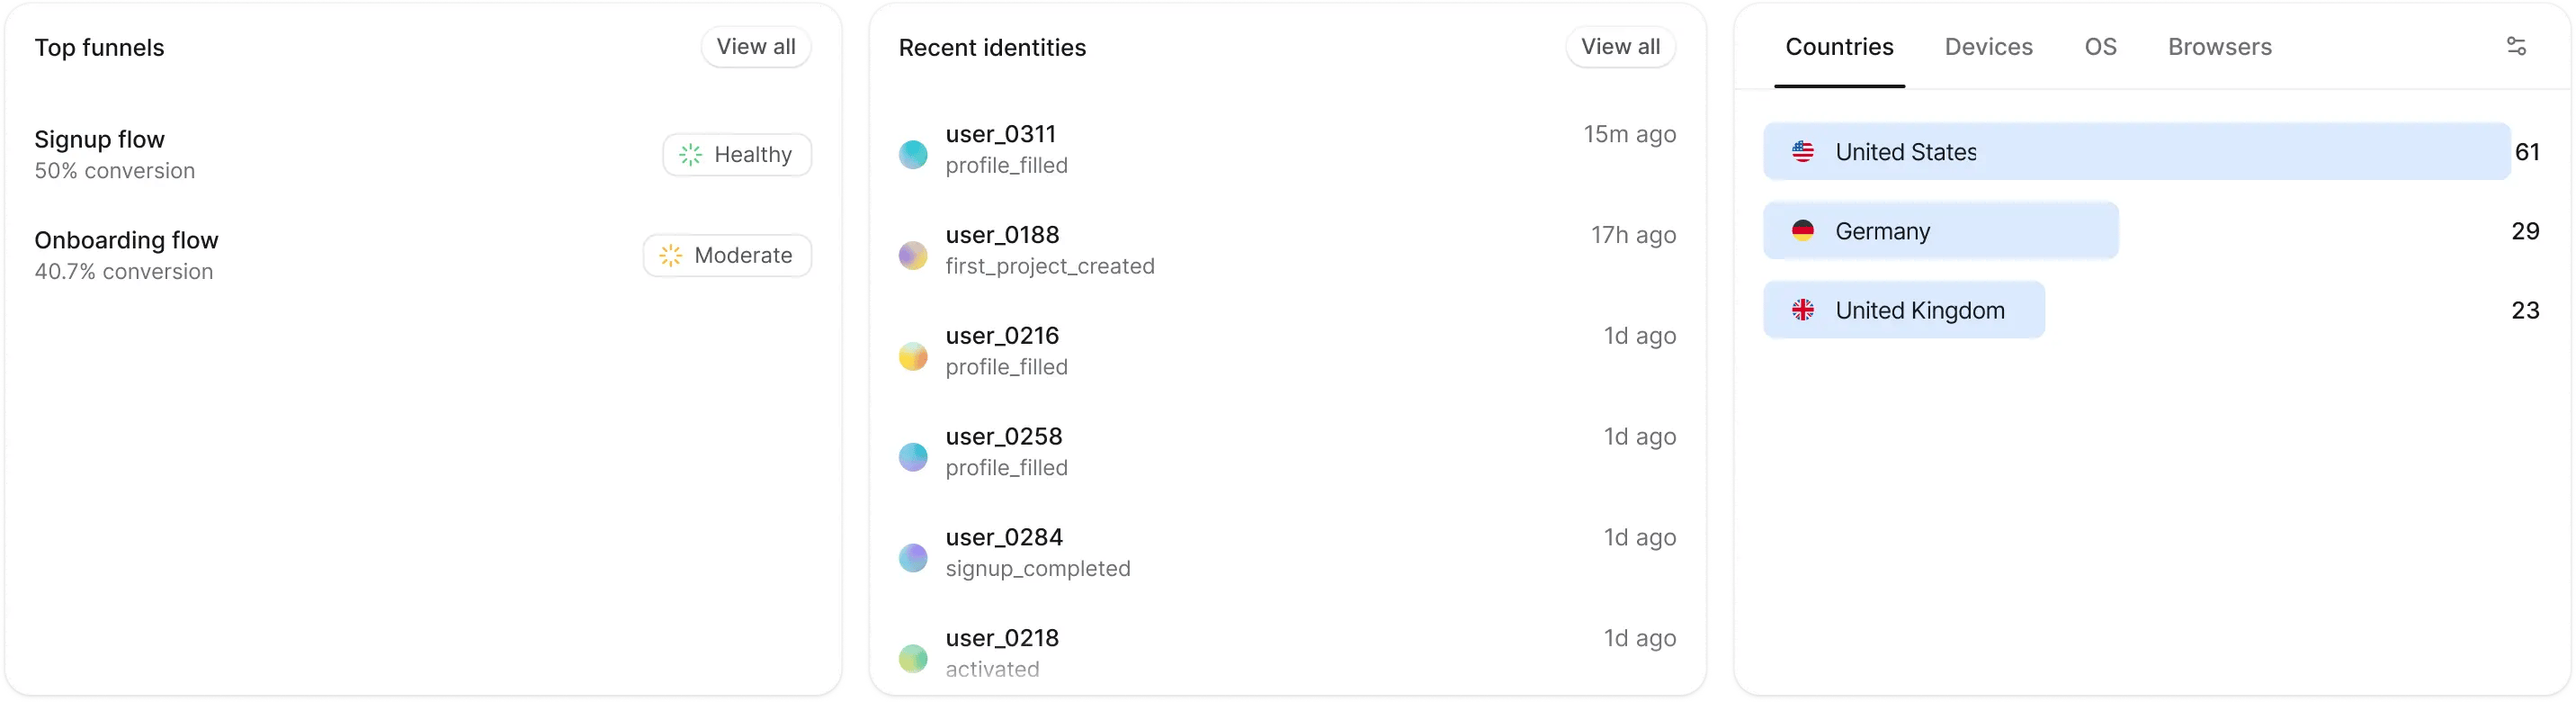
- Recent events shows the latest event batches and their delivery status. View all takes you to the Events page.
- Top funnels lists your funnels sorted by largest drop-off, each with its conversion rate and a health indicator. Hover the indicator for the verdict and what changed. View all takes you to the Funnels page.
- Recent identities shows the most recently seen users and their last step. Clicking one opens that user on the Users page.
- Segment breakdown splits your identities across a dimension. The default tabs are Countries, Devices, OS, and Browsers.
Filtering data
The filter bar sits at the top left of the page. Until you add a filter it reads “All identities and events”.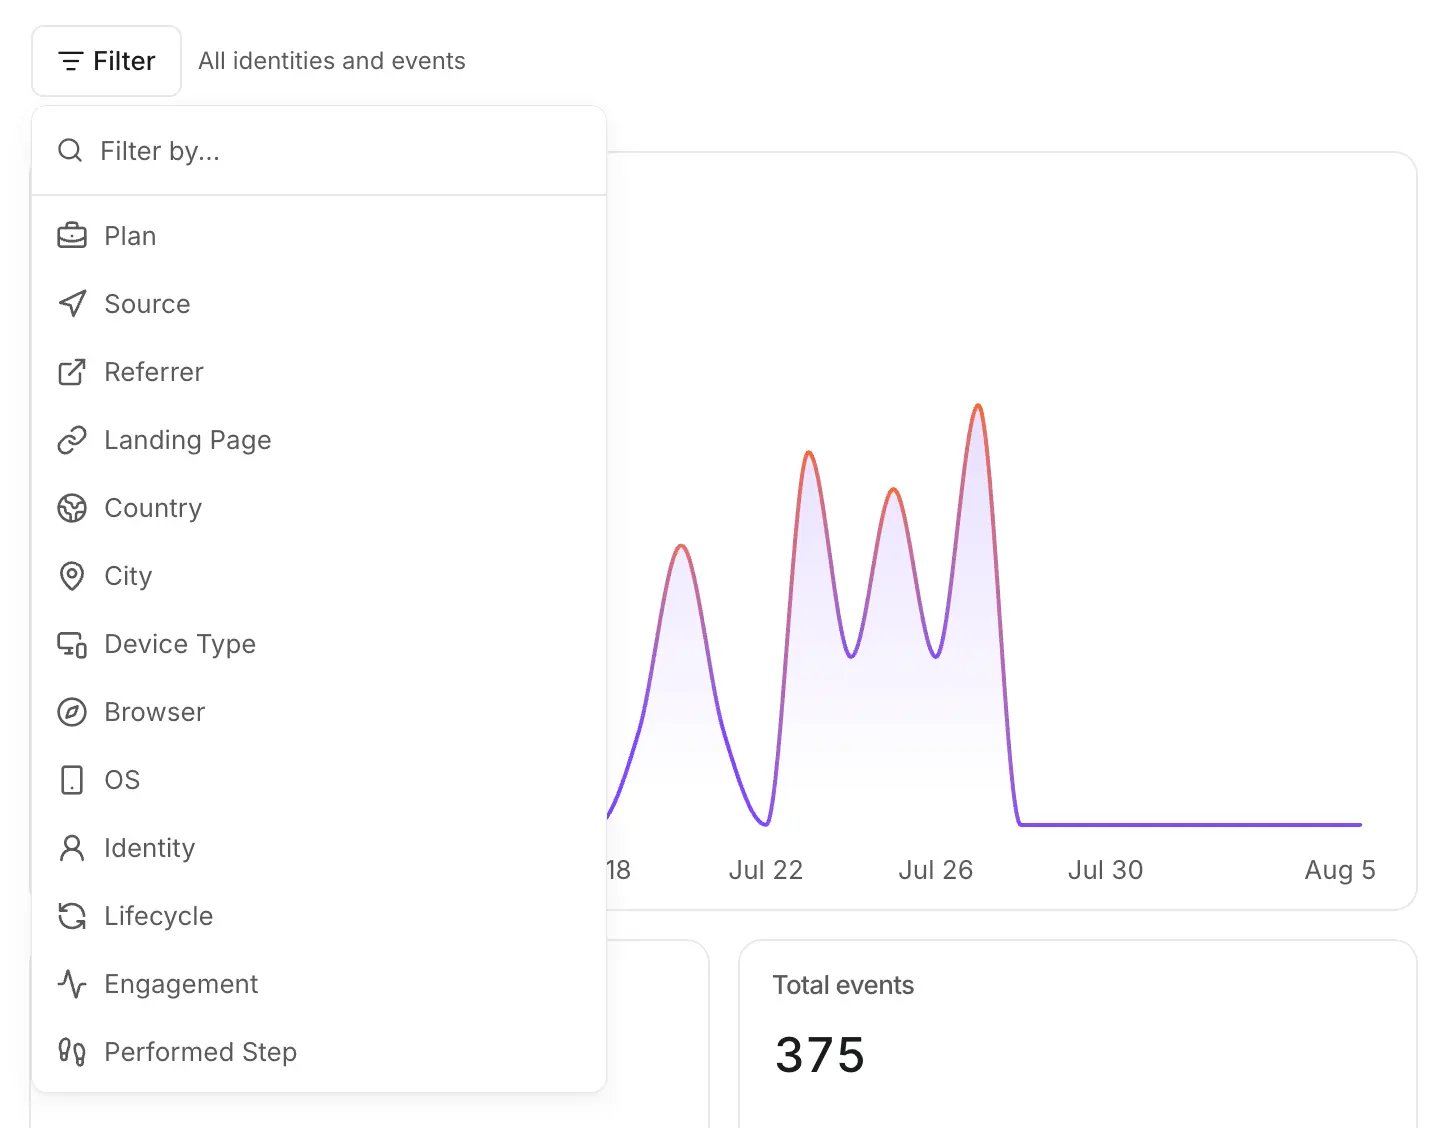
- Plan and Source, from the traits you send with
identify() - Referrer and Landing page
- Country and City
- Device type, Browser, and OS
- Identity: identified users vs anonymous sessions
- Lifecycle: new vs returning identities
- Engagement: single-event vs engaged identities
- Performed step and Did not perform step, to include or exclude people based on funnel steps
- Environment and SDK version
- User trait and Event property, for anything custom you track
Date range picker
The date range picker sits at the top right. It defaults to Last 30 days.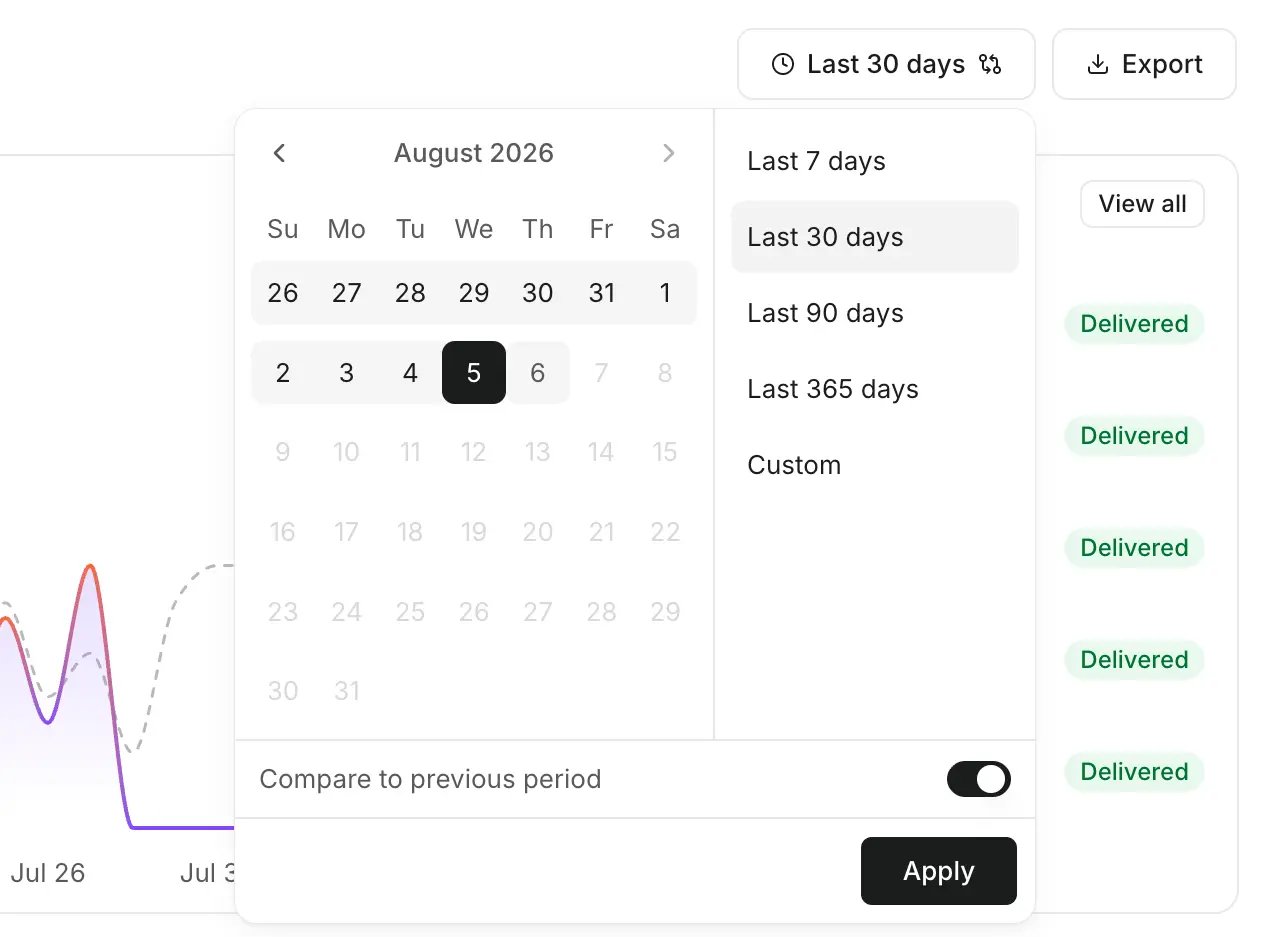
- Presets: Last 7 days, Last 30 days, Last 90 days, Last 365 days, or Custom with a range calendar.
- Compare to previous period adds a comparison line to the trend chart and delta badges to every metric and card.
Presets longer than your plan’s data retention
are locked. Upgrade your plan to unlock longer date ranges.
Exporting your data
The Export button downloads your overview data as CSV:- Trend over time: users and events per day, week, or month
- Segment breakdown: users and engagement by the selected dimension